
Hawkish and Dovish Central Banks
Central banks have a head, a president, or a chairman, much like most other enterprises.
Middle School
简体中文
繁體中文
English
Pусский
日本語
ภาษาไทย
Tiếng Việt
Bahasa Indonesia
Español
हिन्दी
Filippiiniläinen
Français
Deutsch
Português
Türkçe
한국어
العربية
اردو


Central banks have a head, a president, or a chairman, much like most other enterprises.

National governments and their central banking agencies, as previously stated, establish monetary policy to meet certain economic mandates or aims. Central banks and monetary policy are inextricably linked, so you can't discuss one without discussing the other.
The forex market revolves around interest rates! In other words, global interest rates govern the forex market. The interest rate on a currency is perhaps the most important element in influencing its perceived worth.

It's the study of what's happening in this world and around us in terms of economics and finance, with an emphasis on how macroeconomic factors (such as economic growth, inflation, and unemployment) impact whatever we're trading.

A breakout occurs when the price moves beyond a certain level. So, breakout trading is entering trades when momentum is in your favor. Therefore With breakout trades, the aim is to enter the market right when the price makes a breakout and then continue to ride the trade until volatility dies down.
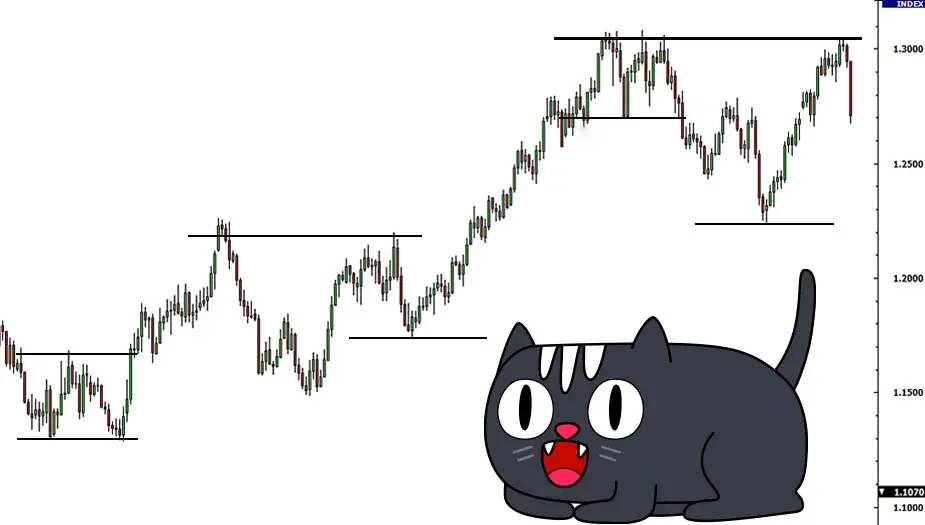
Support and resistance levels generated by trend lines, chart patterns, or past daily highs and lows are common places to look for potential fakeouts.

Trading in the opposite direction of a breakout is known as fading breakouts. Trading FALSE breakouts is the same as trading fading breakouts.

When price "breaks" out of that support or resistance level, one may expect it to continue in the same direction as the break.

There are a few ways to determine whether a trend is nearing its end and a reversal breakout is required.
You should be used to looking at charts and recognizing common chart patterns that signal a reversal breakthrough by now.
When trading forex breakouts, it's crucial to understand that there are two types: Breakouts for more information and Breakouts that revert.

Volatility is a metric that evaluates the overall price swings over a period of time and can be used to spot possible breakouts. There are a few signs that can help you determine how volatile a pair is right now.
Unlike the breakouts you may have experienced as a teenager, a trading breakout is a little different! When the price "breaks out" of a consolidation or trading range, it is known as a breakout.

You can successfully protect yourself from abandoning a position too early during a retracement and exit a reversal in a hurry by using trailing stop loss points.

When you discern between retracements and reversals correctly, you can reduce the number of losing trades and even increase the number of winning trades. It's crucial to identify if a price movement is a retracement or a reversal. It's right up there with paying taxes in terms of importance.

Nobody wants to be smacked by the "Smooth Retracement," yet it does happen from time to time.

A range-bound market is one in which prices bounce back and forth between a specified high and low. The high price works as a key resistance level that the price is unable to overcome.

A trending market is one where the price is moving in one direction. The price may occasionally deviate from the trend, but a closer study of the larger time frames reveals that they were simply retracements.

We need to acquire a situation report on the trading environment, just like in warfare. This necessitates an understanding of the current market climate. Some forex traders bemoan the fact that their system is ineffective.

As a trader, bear in your mind that we use divergence as an indicator, not as a signal to enter a trade, and there are too much false signals from the divergences so depending ok divergences only to trade would not be smart.