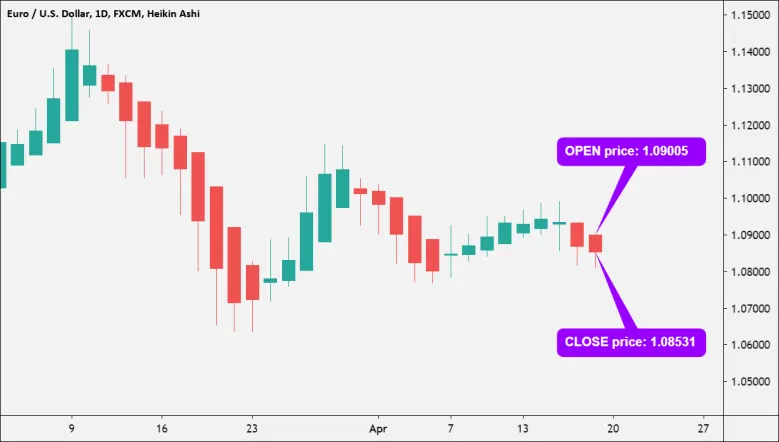
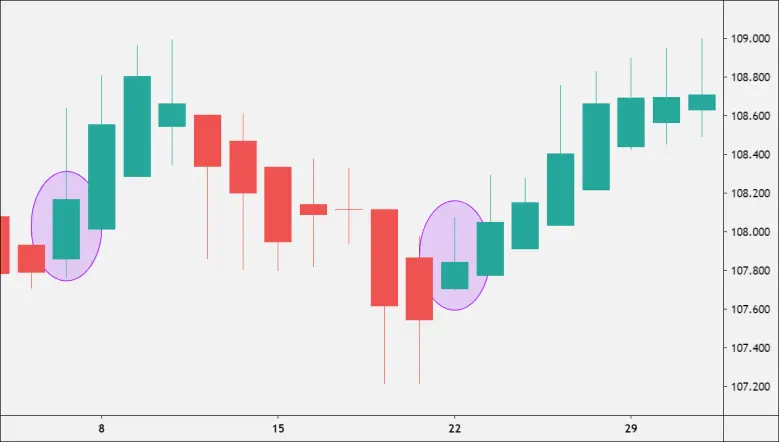
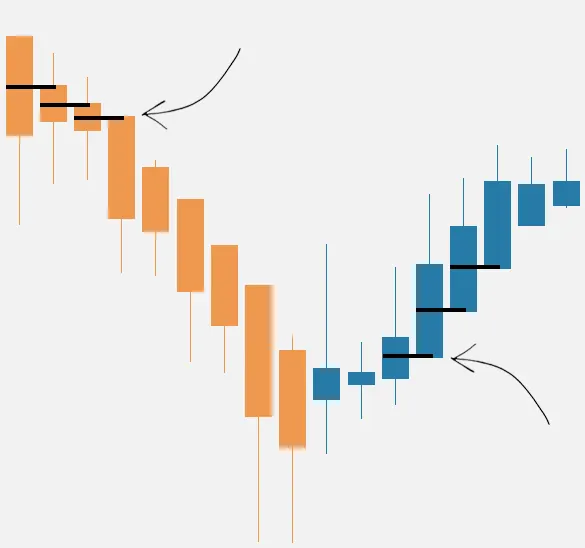
What is Heikin Ashi and How Do You Calculate It?
How is Heikin Ashi calculated? Let's have a look at how Heikin Ashi candlesticks are calculated and displayed on a graph.
简体中文
繁體中文
English
Pусский
日本語
ภาษาไทย
Tiếng Việt
Bahasa Indonesia
Español
हिन्दी
Filippiiniläinen
Français
Deutsch
Português
Türkçe
한국어
العربية

How is Heikin Ashi calculated? Let's have a look at how Heikin Ashi candlesticks are calculated and displayed on a graph.

Range trading is an active investing strategy that identifies a range at which the investor buys and sells at over a short period.

The main classic chart patterns are mentioned here, along with when they are formed, what type of signal they provide, and what the next expected price move is.

Reversal patterns are chart formations that indicate that a current trend is poised to shift direction.

Pennants, like rectangles, are continuation chart patterns that form following big advances. Buyers and sellers often take a breather after a large upward or negative move before continuing to move the pair in the same direction.

When the price is bordered by parallel support and resistance levels, a rectangle is produced on the chart. A rectangle represents a moment of consolidation or hesitation between buyers and sellers as they trade punches but neither has the upper hand.

A reversal pattern, the head and shoulders chart pattern is most commonly observed in uptrends. "Head and shoulders" is well-known not only for trend reversals, but also for dandruff reversals.

A trend reversal has begun when a double top or double bottom chart pattern develops. Let's look at how to recognize and trade these chart patterns.

Consider chart patterns to be a land mine detector; once you've completed this lesson, you'll be able to notice "explosions" on the charts before they happen, potentially making you a lot of money.

MACD and moving averages have already been established as indicators that can do so. At the cost of delayed input, these indicators will identify patterns once they have been formed.

Any object or data that oscillates between two points is called an oscillator. To put it another way, it's something that will always fall someplace between point A and point B.

The Average Directional Index, or ADX, is a tool for determining the comprehensive strength of a trend. It is based on the idea that trading, when the market is moving in the direction of a strong trend, increases the chances of profit and lowers the risk by a considerable margin.

As a result, the more tools you have, the more you'll be able to ADAPT to the always altering market environment. It's also fine if you want to concentrate on a few specialized trading settings or tools.

The main purpose of the moving average is to eliminate short-term fluctuations in the market. Because moving averages represent an average closing price over a selected period of time, the moving average allows traders to identify the overall trend of the market in a simple way.

The Guppy Multiple Moving Average (GMMA) is a technical indicator that aims to anticipate a potential breakout in the price of an asset. The term gets its name from Daryl Guppy.

Moving average ribbons are a series of moving averages (MA) of different lengths that are plotted on the same chart to create a ribbon-like indicator. Traders can determine the strength of a trend by looking at the distance between the moving averages, as well as identify key areas of support or resistance by looking at the price in relation to the ribbon.

Moving averages (MA) are a popular trading tool. Unfortunately, they are prone to giving false signals in choppy markets. By applying an envelope to the moving average, some of these whipsaw trades can be avoided, and traders can increase their profits. Envelopes trading has been a favorite tool among technical analysts for years, and incorporating that technique with MAs makes for a useful combination.

Moving Average can be use is numerous way, the other way to use moving averages is to use them as dynamic support and resistance levels. It is called dynamic because it’s not like your traditional horizontal support and resistance lines. They are constantly changing depending on recent price action, therefore they are not stable.

You have learned how to determine the trend by plotting some moving averages on your charts. You should also get to know that moving averages can assist you in determining when a trend is about to end and reverse. And As trend traders, you want to recognize and ride the trend for as long as possible for you to know when to get in and when to get out of the trend.

Moving averages can also be used to assist you determine the trend. The most straightforward method is to simply plot a single moving average on the chart. When price movement tends to stay above the moving average, it indicates that the market is generally in a UPTREND. Price movement that tends to stay below the moving average implies that the market is in a DOWNTREND.