
Global Broker Regulation Inquiry App
About WikiFX
English
简体中文
繁體中文
English
Pусский
日本語
ภาษาไทย
Tiếng Việt
Bahasa Indonesia
Español
हिन्दी
Filippiiniläinen
Français
Deutsch
Português
Türkçe
한국어
العربية
DBG Markets: Market Report for Apr 20, 2026
Abstract:Geopolitical Uncertainty Returns as US-Iran Ceasefire Nears ExpirationWeekly Outlook: Dollar, Gold, Crude Oil IndicesThe global financial markets are entering a highly volatile and uncertain week. Th

Geopolitical Uncertainty Returns as US-Iran Ceasefire Nears ExpirationWeekly Outlook: Dollar, Gold, Crude Oil & Indices
The global financial markets are entering a highly volatile and uncertain week. The optimism that drove the recent risk-on rally is rapidly fading as diplomatic efforts in the Middle East hit a major roadblock. This is abruptly shifting the focus back to geopolitical risks, even as the second week of the US corporate earnings season and key global inflation data take center stage.
US Dollar (DXY) Outlook: Safe-Haven Bids Return
With geopolitical uncertainty roaring back to life, the US Dollar is once again catching a bid as emergency safe-haven capital flows return to the market.
However, the Dollar remains at a critical technical juncture. It is yet to be seen whether this safe-haven bid is a long-lived trend or just a short-lived reaction to the weekend opening.
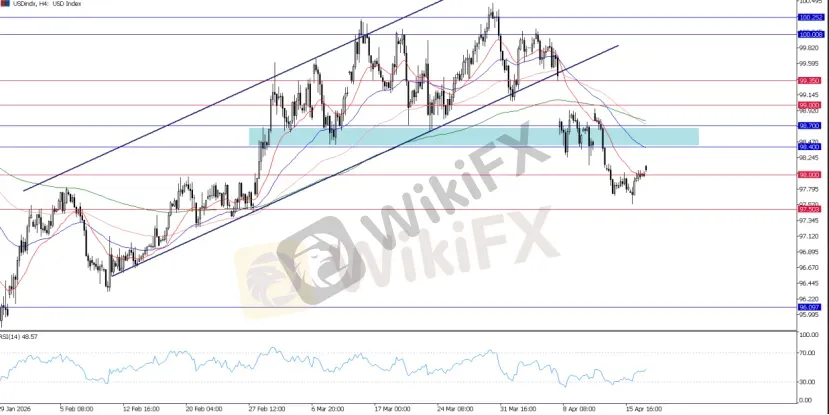
USD Index, H4 Chart
Traders must closely watch the 98.00 level to see if the US Dollar Index can firmly hold this support floor. Last week, the Dollar Index broke below 98.00 but quickly regained it over the weekend.
This means that 98.00 acts as the ultimate pivot line for now. A sustained defense of 98.00 will confirm the return of safe-haven dominance, while a break below would signal underlying structural weakness despite the geopolitical panic.
Technically, the broader downtrend structure remains fully intact as long as the price stays below the 98.70 area.
USDJPY Outlook: Extended Consolidation and Reversal Risks
While the Dollar Index poses fundamental uncertainty, the USDJPY pair remains trapped in an extended phase of high-side consolidation. Despite the returning safe-haven flows for the Dollar, the upside for this pair appears heavily capped.
While the Dollar is the primary market driver, the Japanese Yen is also being influenced by its own domestic forces and safe-haven flows.
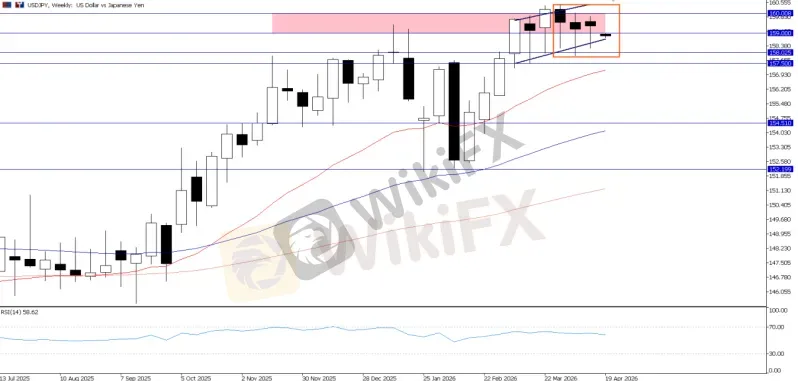
USDJPY, Weekly Chart
From a technical perspective, a three-week bearish setup and a "hanging man" candlestick pattern are potentially forming on the higher timeframes. This heavily suggests that the bulls are finding it difficult to truly dominate the market.
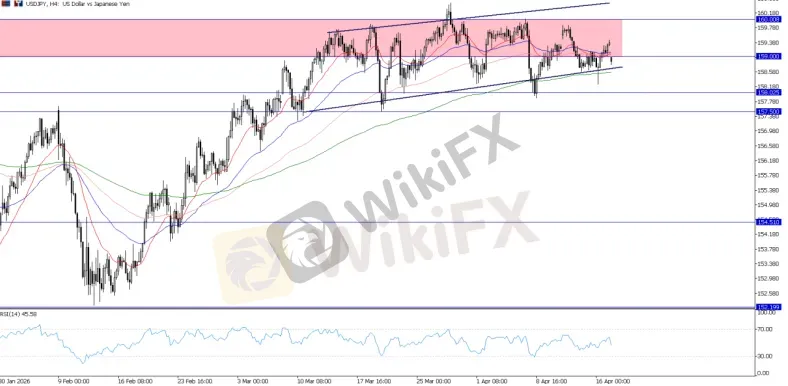
USDJPY, H4 Chart
However, in the near term, traders must strictly watch for a definitive breakout from this consolidation zone to confirm the pair's next major directional move.
As of now, the 159.00 to 160.00 zone continues to pose as a major resistance block. A near-term breakout above or below this consolidated structure will likely dictate the next macroeconomic leg.
Gold Outlook: Capped by the Dollar
Gold is once again caught in a fundamental crossfire. While rising geopolitical tensions traditionally support the precious metal, the simultaneous surge in the safe-haven US Dollar is aggressively capping its upside potential.
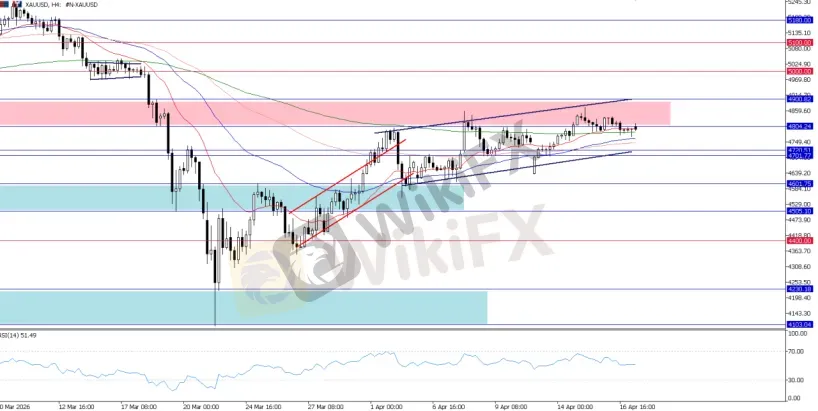
XAUUSD, H4 Chart
Technically, the massive $4,800 to $4,900 resistance zone continues to be the critical area to watch. The upside for Gold remains firmly capped by this ceiling. In the near term, Gold's trajectory will be heavily driven by the performance of the US Dollar, so traders must monitor the Dollar closely to gauge XAUUSD's next leg.
Brent Crude (UKOIL) Outlook: Finding Support Above $90.00
The energy sector remains highly sensitive to the collapsing ceasefire narrative. While Brent Crude (UKOIL) experienced a downward correction last week as the war premium temporarily drained, the shifting geopolitical landscape is aggressively halting the slide.
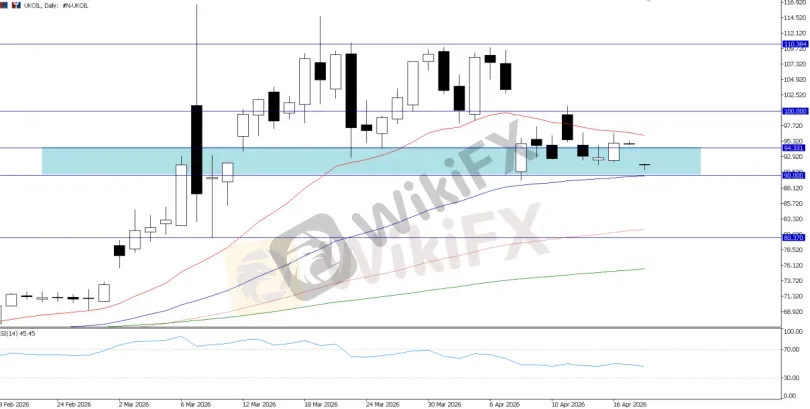
UKOIL, Daily Chart
Despite last week's losses, UKOIL remains structurally supported above the critical $90.00 mark. As the April 22 ceasefire expiration looms, expect the war premium to rapidly price back into the market, keeping oil prices highly elevated and firmly defended at this support level.
As covered earlier, without a clear easing of tensions in the Middle East, the risk premium is unlikely to be fully priced out. From a technical perspective, the $90.00 to $100.00 range remains a crucial zone to watch. While $90.00 serves as a rock-solid support floor, we need to see a clear breakdown below this mark to confirm a truly bear-dominated market.
S&P 500 (US500) Outlook: Cautious Optimism
US equities face a major stress test this week. While the overarching structural upside remains intact, fueled by resilient corporate earnings, the rising geopolitical temperature poses a severe threat to the rally.
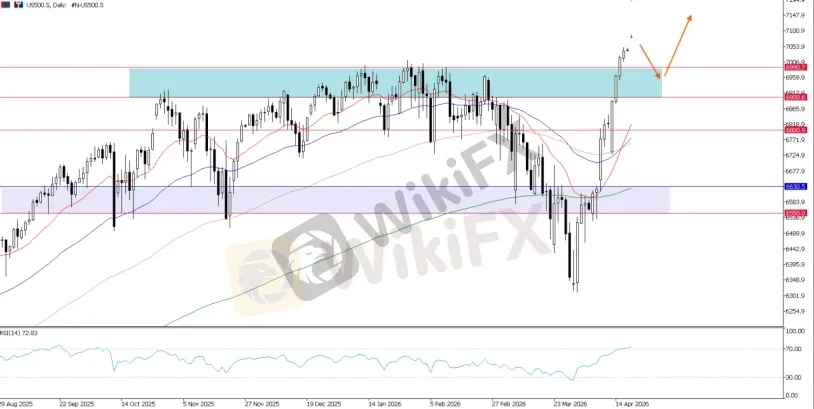
US500, Daily Chart
Technically, all eyes are on the monumental 6,990 to 7,000 level for the S&P 500. Traders need to see if the index can successfully hold this high-water mark. While the broader bullish bias remains, market participants must be highly cautious of any sudden, violent downward turns triggered by breaking Middle East headlines.
There is no doubt that the overall outlook for equities remains positive this week, but it must be approached with a much more cautious tone.

Disclaimer:
The views in this article only represent the author's personal views, and do not constitute investment advice on this platform. This platform does not guarantee the accuracy, completeness and timeliness of the information in the article, and will not be liable for any loss caused by the use of or reliance on the information in the article.
WikiFX Broker
Latest News
'Resumption of hostilities': seized ship, vessel attacks push U.S.-Iran ceasefire toward brink
 WikiFX
Anatomy of Currency Pairs: Why New Traders Start With EUR/USD
WikiFXXTB Fined PLN 20 Million by Polish Regulator Over CFD-Related Compliance Issues
WikiFXDaman Securities Regulation: Is It Safe or High Risk?
WikiFXPrimeWaveFX Review 2026 – Should You Trade With This Broker?
WikiFXSEB Regulation: Is SEB Licensed or High Risk?
WikiFXWhy Small Forex Mistakes Turn Into Stressful Account Blowouts
WikiFXCapital Fx Review 2026: Is This Forex Broker Safe?
WikiFXUAE Finfluencer Rules Face Their Next Test: Disclosure, Oversight, and Platform Promotion
WikiFXWarren Bowie & Smith Regulation: Is It Safe or Risky?
WikiFXCurrency Calculator
USD

CNY
Current Rate:0
Enter amount
USD
Redeemable Amount
CNY
Calculate 