
Global Broker Regulation Inquiry App
About WikiFX
English
简体中文
繁體中文
English
Pусский
日本語
ภาษาไทย
Tiếng Việt
Bahasa Indonesia
Español
हिन्दी
Filippiiniläinen
Français
Deutsch
Português
Türkçe
한국어
العربية
FPG USOUSD Market Report March 5, 2026
Abstract:On the H4 timeframe chart, USOUSD (US Oil) previously moved within a relatively stable sideways channel for several weeks before a strong fundamental catalyst triggered a breakout above the upper boun
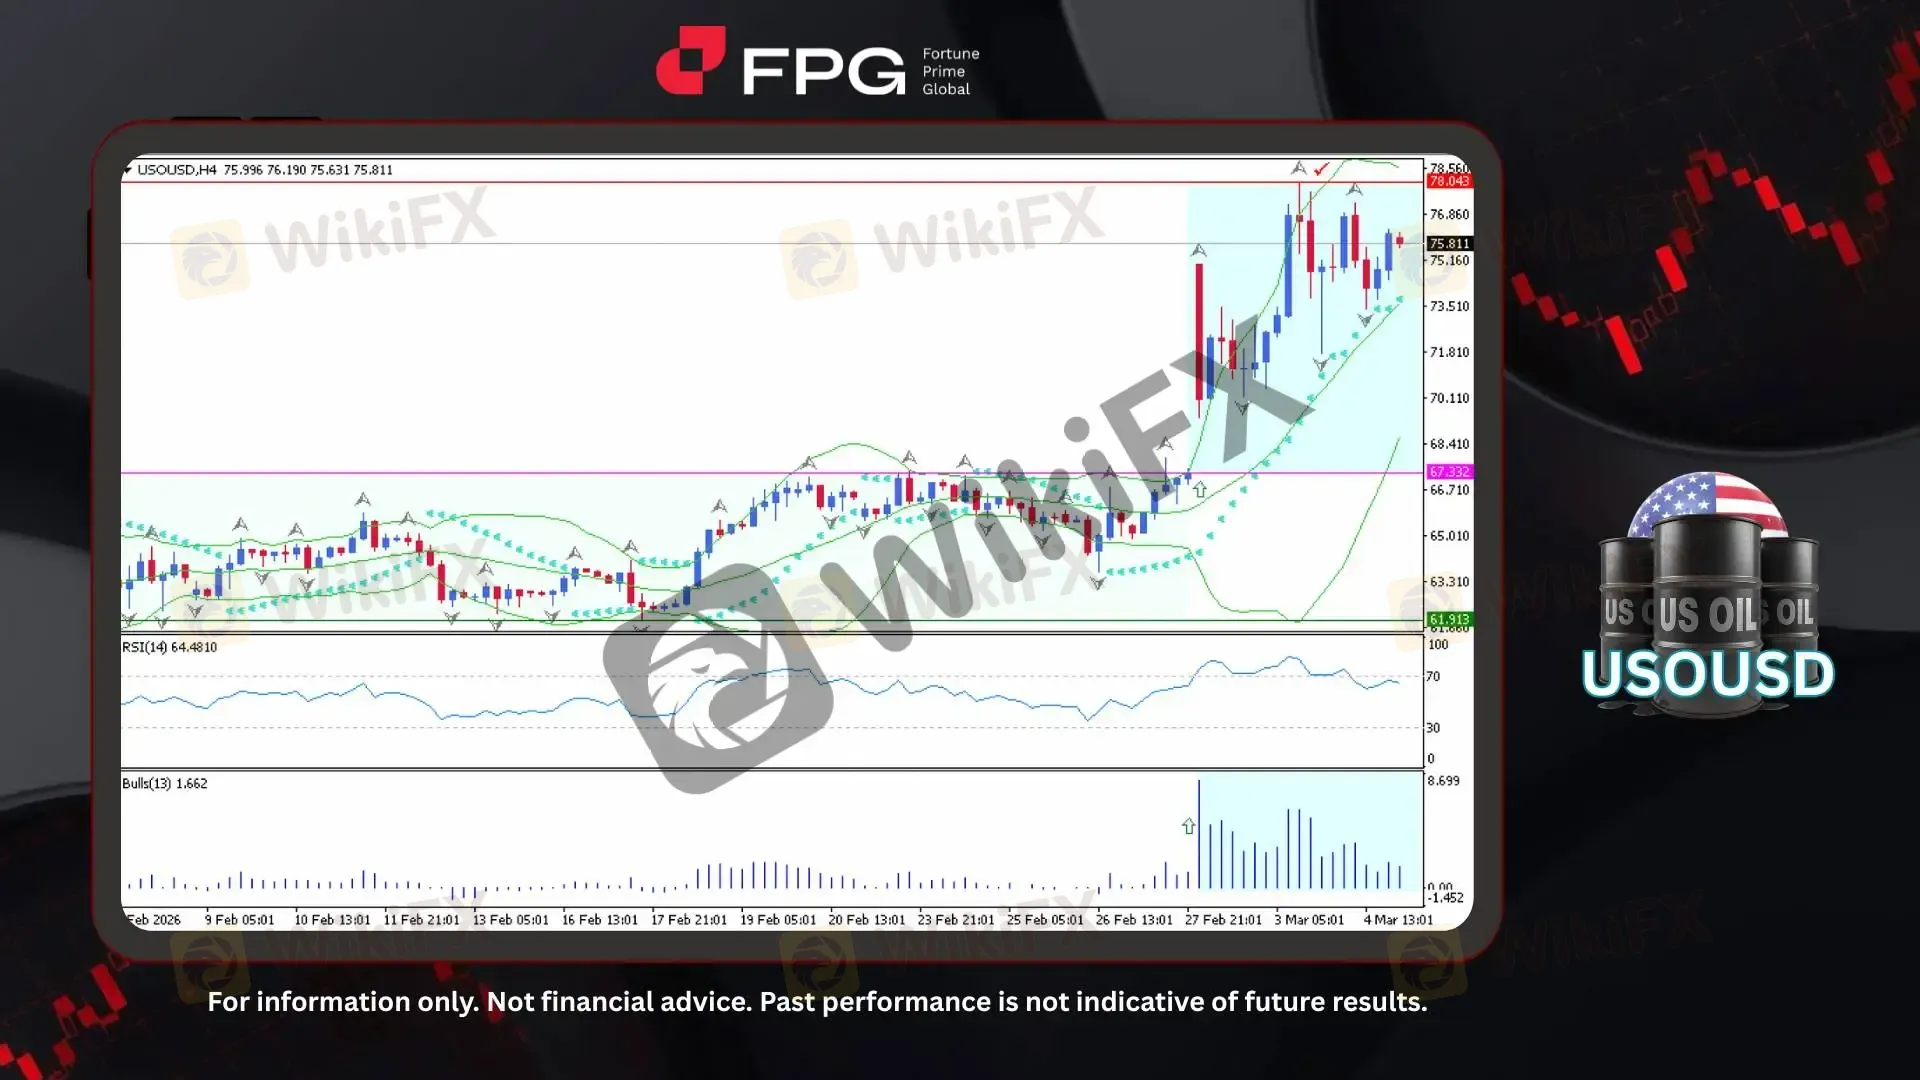
On the H4 timeframe chart, USOUSD (US Oil) previously moved within a relatively stable sideways channel for several weeks before a strong fundamental catalyst triggered a breakout above the upper boundary at 67.33. This breakout initiated a sharp bullish rally that pushed the price toward the 78.04 peak. Following this surge, price action became significantly more volatile, reflecting aggressive buying and profit-taking activity within the market. Currently, USOUSD is trading around 75.81, maintaining a generally bullish structure despite increasingly reactive intraday fluctuations.
From a technical perspective, Bollinger Bands have expanded notably following the breakout phase, indicating a surge in volatility as the market transitioned from consolidation into a strong trending move. Price remains positioned above the midline of the Bollinger Bands, suggesting that the broader bullish momentum remains intact despite short-term pullbacks. The RSI (14) is currently hovering around 64, indicating healthy bullish momentum while still remaining below the overbought threshold, leaving room for potential continuation to the upside. Meanwhile, Bulls Power remains clearly positive and elevated, reflecting strong buyer dominance and confirming that upward pressure remains active within the current trend structure.
The connection between technical analysis and fundamental developments remains crucial in explaining recent USOUSD price behavior, as chart movements often mirror underlying macroeconomic and geopolitical conditions. Recent price gains have been heavily influenced by escalating tensions in the Middle East, particularly concerns regarding potential supply disruptions through the Strait of Hormuz, which have added a geopolitical risk premium to crude oil prices. Major financial institutions such as Goldman Sachs have warned that prolonged supply constraints could potentially push oil prices toward the $100 per barrel region, reinforcing bullish sentiment across the energy market. At the same time, OPEC+ production policy decisions, fluctuations in U.S. crude inventory data, global demand expectations, and movements in the U.S. Dollar Index continue to contribute to heightened volatility and shape the broader directional outlook for oil prices.
Market Observation
1. Current Position: USOUSD is trading around 75.81, maintaining a strong bullish structure after breaking above the former consolidation ceiling at 67.33.
2. Resistance Zone: The nearest resistance is located at 78.04, representing the recent swing high formed during the breakout rally.
3. Support Zone: Immediate support stands near 73.51, which aligns with the rising Bollinger midline and recent pullback area.
4. Indicator Observation: Bollinger Bands show expanded volatility following the breakout, with price holding above the mid-band. RSI (14) remains around 64, indicating sustained bullish momentum without entering overbought territory, while Bulls Power remains strongly positive, confirming continued buying pressure.
Market Performance:
Commodities Last Price % Change
UKOUSD 82.80 +0.72%
Today's Key Economic Calendar:
AU: Balance of Trade
UK: S&P Global Construction PMI
EU: Retail Sales MoM
EU: ECB Monetary Policy Meeting Accounts
US: Export & Import Prices MoM
US: Initial Jobless Claims
US: Nonfarm Productivity QoQ Preliminary
US: Unit Labour Costs QoQ Preliminary
Risk Disclaimer: This report is for informational purposes only and does not constitute financial advice. Investments involve risks, and past performance does not guarantee future results. Consult your financial advisor for personalized investment strategies.
Disclaimer:
The views in this article only represent the author's personal views, and do not constitute investment advice on this platform. This platform does not guarantee the accuracy, completeness and timeliness of the information in the article, and will not be liable for any loss caused by the use of or reliance on the information in the article.
WikiFX Broker
Latest News
'Resumption of hostilities': seized ship, vessel attacks push U.S.-Iran ceasefire toward brink
 WikiFX
Anatomy of Currency Pairs: Why New Traders Start With EUR/USD
WikiFXXTB Fined PLN 20 Million by Polish Regulator Over CFD-Related Compliance Issues
WikiFXDaman Securities Regulation: Is It Safe or High Risk?
WikiFXPrimeWaveFX Review 2026 – Should You Trade With This Broker?
WikiFXSEB Regulation: Is SEB Licensed or High Risk?
WikiFXWhy Your Forex Trade Executed at the Wrong Price
WikiFX24markets Regulation: Is 24markets FSC Regulated?
WikiFXdbinvesting Review 2026: Is this Forex Broker Legit or a Scam?
WikiFXBAXIA MARKETS Regulation: Is BAXIA MARKETS Regulated?
WikiFXCurrency Calculator
USD

CNY
Current Rate:0
Enter amount
USD
Redeemable Amount
CNY
Calculate 