
Global Broker Regulation Inquiry App
WikiFX
English
简体中文
繁體中文
English
Pусский
日本語
ภาษาไทย
Tiếng Việt
Bahasa Indonesia
Español
हिन्दी
Filippiiniläinen
Français
Deutsch
Português
Türkçe
한국어
العربية
DBG Markets: Market Report for Jan 19, 2026
Abstract:DBG Markets Weekly: The Greenland Ultimatum and Trade War VolatilityThe financial landscape has shifted dramatically over the weekend. Markets are now forced to navigate a sudden geopolitical shock as
DBG Markets Weekly: The Greenland Ultimatum and Trade War Volatility
The financial landscape has shifted dramatically over the weekend. Markets are now forced to navigate a sudden geopolitical shock as the U.S. and Europe enter a new, more severe phase of trade friction, overshadowing previous gains.
US Equities: Record Highs Under Siege
Wall Street hit fresh record highs last week, but those gains are now under significant pressure. Monday's open saw a sharp pullback in U.S. futures as tech optimism is overshadowed by the fear of supply chain disruptions and a new wave of trade wars.
Rising U.S.–EU trade tensions could cap upside potential. A further escalation may trigger a broader risk-off move and deeper corrections in risk assets.
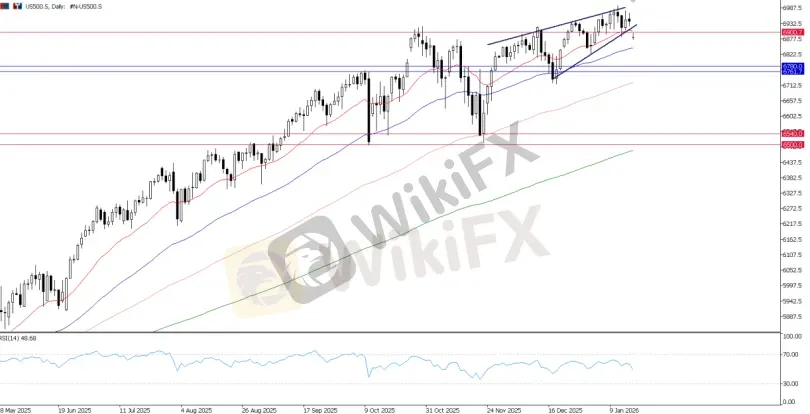
US500 (S&P500), Daily Chart
From a technical perspective, the S&P 500's previous Rising Wedge formation has exerted clear pressure on the upside, signaling that bullish momentum is exhausting at these record levels. Following the index's break below the 6,900 key level, the short-term outlook has turned cautious as downside correction risks increase.
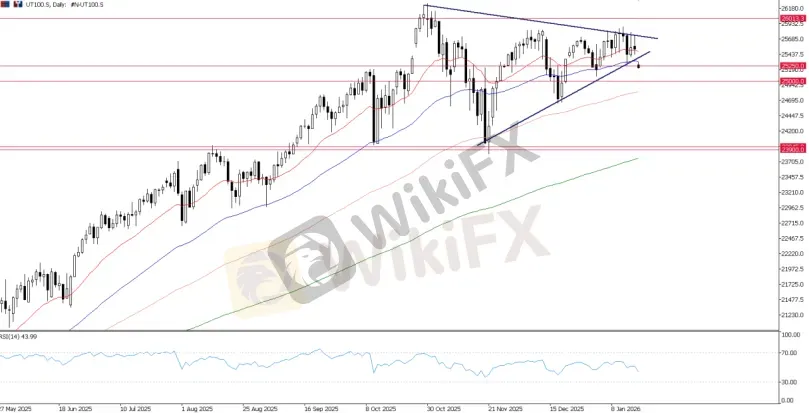
UT100 (Nasdaq 100), Daily Chart
Similar to the S&P 500, the UT100 shows a comparable setup, with the recent Converging Triangle potentially breaking to the downside. On a technical level, a clear break below the 25,000 – 25,250 area would likely trigger a renewed round of selling pressure.
Outlook: For the coming week, any further escalation may trigger a broader risk-off environment and deeper corrections across risk assets, including the Nasdaq 100 (UT100) and the US30.
US Dollar & PCE: The Inflation Floor
The US Dollar Index rally faces a test as the “uncertainty premium” rises. While tariffs are generally dollar-bullish, the geopolitical friction is creating a volatile environment for the USD.
Meanwhile, the dollar also faces an inflation data test this week; the Feds preferred inflation gauge, the PCE Price Index, is expected to be released on January 22 (Thursday). However, the impact may be secondary compared to the geopolitical front.
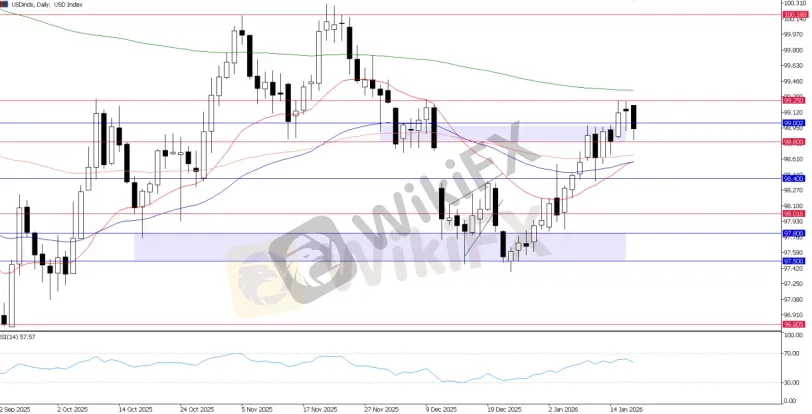
USD Index, Daily Chart
Technically, the US Dollar's upside remains intact. However, resistance at 99.250 pushed the dollar down during the Asian opening on Monday. This reflects that geopolitical friction and trade war uncertainty could weigh on the dollar, creating a more volatile environment.
Outlook: 99.250 – 98.80 remains a decisive zone for the Dollar Index this week. While rising tensions could weigh on the currency, we await technical confirmation.
Yen Outlook: Dual-Tailwinds and BoJ Caution
The Japanese Yen is currently caught in a complex web of intervention threats and safe-haven demand.
· The Upside: The JPY is benefiting from intervention fears as it nears the critical 160.00 level, combined with safe-haven flows triggered by EU-US trade tensions.
· The Risk: The Bank of Japan (BoJ) concludes its policy meeting this Friday, Jan 23. While they are expected to hold rates at 0.75%, the market is hyper-focused on Governor Uedas tone regarding currency weakness.
If the BoJ refrains from a hawkish tilt, the “intervention bet” could fade quickly, leaving the Yen vulnerable unless trade war fears intensify further.
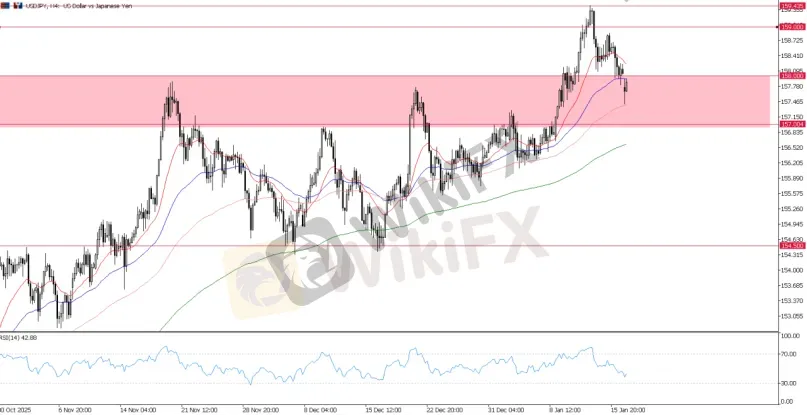
USDJPY, H4 Chart
Technically, the key focus for USDJPY lies at 158.00. A failure to regain ground above this level would signal that USDJPY could face near-term pressure (Yen strengthening). Conversely, a move back above 158.00 would likely see USDJPY enter a period of consolidation between 158.00 – 159.00 ahead of the next major catalyst.
Outlook: A clean break below 158.00 – 157.00 would justify Yen momentum and likely lead to a reversal in USDJPY (Bullish Yen reversal), especially given current fundamental tailwinds.
Gold: The Ultimate Haven
Gold has emerged as the clear winner of the weekend's chaos, gapping higher to trade near $4,690 on Monday morning. The combination of a potential transatlantic trade war and “Fed Probe” headlines has created a perfect storm for precious metals.
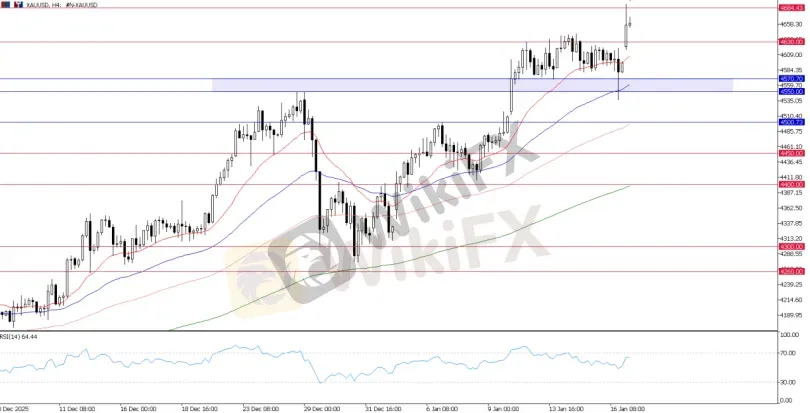
XAU/USD, H4 Chart
Gold is currently in uncharted territory. Resistance is psychological at $4,700, while support has moved up to $4,630. As long as Greenland and tariff headlines dominate the news cycle, “buying the dip” remains a core institutional strategy.
On the other hand, major support lies in the $4,550 – $4,570 zone. These levels are critical in validating whether the gold rally can be sustained. A clear break below this zone could signal the end of the current upward wave.
Weekly Outlook Summary: A Geopolitical Tightrope
The week ahead represents a critical juncture for global markets as the “Greenland Ultimatum” fundamentally alters the risk landscape. We are moving from a narrative driven solely by central bank policy to one dominated by geopolitical brinkmanship.
The Bottom Line: Investors should prepare for a week of asymmetric volatility. Defensive positioning is paramount as the market navigates the dual threats of a transatlantic trade rift and a high-stakes Bank of Japan meeting.
Disclaimer:
The views in this article only represent the author's personal views, and do not constitute investment advice on this platform. This platform does not guarantee the accuracy, completeness and timeliness of the information in the article, and will not be liable for any loss caused by the use of or reliance on the information in the article.
WikiFX Broker
Latest News
Understanding Dbinvesting Deposit and Withdrawal: What Traders Should Know
 WikiFX
TradeEU Global Review 2026: Is this Forex Broker Legit or a Scam?
WikiFXEmerging Markets: South African Fiscal Strains in Focus Amid Calls for SOE Reform
WikiFXChina Economic Watch: PMI Divergence and "Two Sessions" Signal Structural Shift
WikiFXIs Tradier a trustworthy broker? A Tradier review and licensing overview based on WikiFX data.
WikiFXOil Spikes 9% and Shipping Rates Soar as Middle East Logistics Fracture
WikiFXAssetsFX Review 2026: Is this Broker Safe?
WikiFXFed Beige Book: Stagflation Risks Rise as Growth Stalls While Prices Stick
WikiFXAsia Market Volatility: KOSPI Stages Historic 12% Rebound as Capital Flows Pivot
WikiFXEvest Broker Review: Regulated, but Complaints Persist
WikiFXCurrency Calculator
USD

CNY
Current Rate:0
Amount
USD
Available
CNY
Calculate 