Abstract:TradingView introduces Fundamental Graphs, allowing users to easily compare financial metrics across multiple companies and enhance their investment strategy with data-driven insights.
TradingView has launched a powerful new feature for investors and traders: Fundamental Graphs. This tool is designed to help users compare key financial metrics on TradingView, offering an intuitive way to visualize company fundamentals easily and refine analysis—whether youre a novice trader or a seasoned analyst.
Visualize Company Fundamentals Easily
The ever-growing complexity of financial markets demands tools that deliver insights efficiently. TradingView‘s Fundamental Graphs address this need by allowing users to visualize company fundamentals easily. Investors can delve into earnings per share (EPS), revenue, profit, R&D spending, and more. By presenting these metrics side by side, the platform offers a clear view of a company’s financial health, helping you move beyond price charts and into the realm of fundamental analysis for a well-rounded perspective.
Multi-Symbol Fundamental Data Comparison
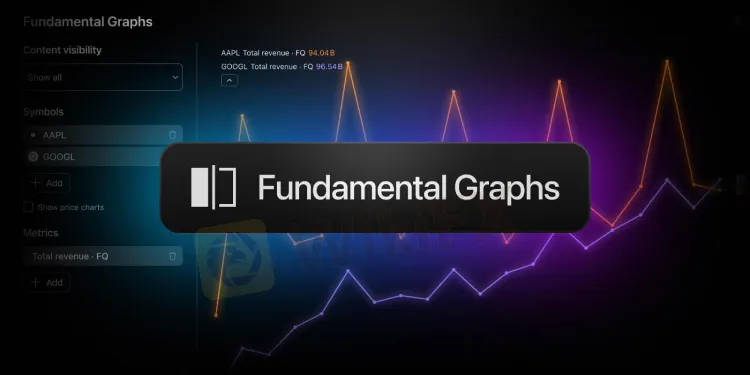
One standout feature is multi-symbol fundamental data comparison. With the ability to add or remove up to nine symbols and nine metrics in a single chart, users can quickly gauge performance across companies and industries. Whether youre evaluating tech giants or comparing competitors within a single sector, this tool brings all relevant financial data into focus. Switching between symbols and metrics is seamless, letting you customize your comparison for rapid, reliable investment insights.
Customize Financial Charts for Analysis
TradingView excels in chart customization. The Fundamental Graphs interface is user-friendly and built for flexibility. Users can choose from various visibility modes—showing all metrics for all symbols, focusing on one company‘s full suite of metrics, or zeroing in on how each company fares in a single financial category. The control panel allows for adjustments to chart scale (from regular to logarithmic or indexed views) and date range, letting you tailor every chart to your analysis style. Plus, price charts can be toggled on or off, ensuring fundamental data doesn’t get lost in price volatility.
Enhance Investment Strategy with Data
Fundamental Graphs help users enhance investment strategy with data. Instead of relying solely on technical signals, you can base decisions on real business performance—backed by data from income statements, balance sheets, and cash flow. Every chart configuration is automatically saved to a unique URL, making it easy to share analyses with colleagues or clients. Instant snapshots let you document findings for future reference, promoting better collaboration and decision-making.
Smarter Comparisons, Stronger Decisions
Imagine trying to discover which tech stock is scaling efficiently or which competitor might be stagnating. With TradingView, you can visualize metrics ranging from quarterly revenue growth to R&D investments—in one chart and at a glance. This multi-metric, multi-symbol approach means investors can spot trends, divergences, and opportunities that would be difficult to identify through traditional research methods.
In fast-moving markets, data-driven tools are vital. TradingView‘s Fundamental Graphs empower you to compare key financial metrics, visualize company fundamentals easily, perform multi-symbol fundamental data comparison, and customize financial charts for analysis—all in an effort to enhance investment strategy with data. It’s an essential upgrade for anyone serious about navigating todays complex equity markets with confidence.
Don't miss out on the latest news and updates of TradingView. Download and install the WikiFX app on your smartphone by scanning the QR code below.
