


India Q1 FY27 GDP Growth Hits 7.8%: 3 Scenarios for INR and Gold
India's Q1 FY27 GDP grew 7.8%, beating a 7.4% poll and RBI's 7.0% projection. See three conditional scenarios for INR, rates and gold.
Original

简体中文
繁體中文
English
Pусский
日本語
ภาษาไทย
Tiếng Việt
Bahasa Indonesia
Español
हिन्दी
Filippiiniläinen
Français
Deutsch
Português
Türkçe
한국어
العربية
اردو




Abstract:Unlock the power of forex chart patterns! Learn how to spot trends, avoid common mistakes, and use triangles, head and shoulders, and flags to maximize profits.
The foreign exchange (forex) market is a vast, high-stakes environment where currency values constantly fluctuate based on economic factors, news events, and market sentiment. One of the essential tools that forex traders use to interpret the complex dynamics of the market is technical analysis, which often includes chart patterns. Chart patterns are visual representations of price movements that help traders predict future market behavior.
This article delves into the top forex chart patterns every trader must know. By understanding these patterns and learning how to read them, traders can enhance their strategies, identify profitable opportunities, and minimize risk. We will explore how these patterns show market movements, how trader psychology influences pattern formation, common mistakes traders make, and how to effectively spot profit signals using chart patterns. Additionally, we will look at how to set stops and targets to manage risk effectively.
 Contents
Chart patterns are not just random formations; they are the result of supply and demand forces at play in the market. By interpreting these patterns, traders can gauge whether the market is in an uptrend, a downtrend, or consolidating. Recognizing these market conditions early can help traders make informed decisions about when to enter or exit trades.
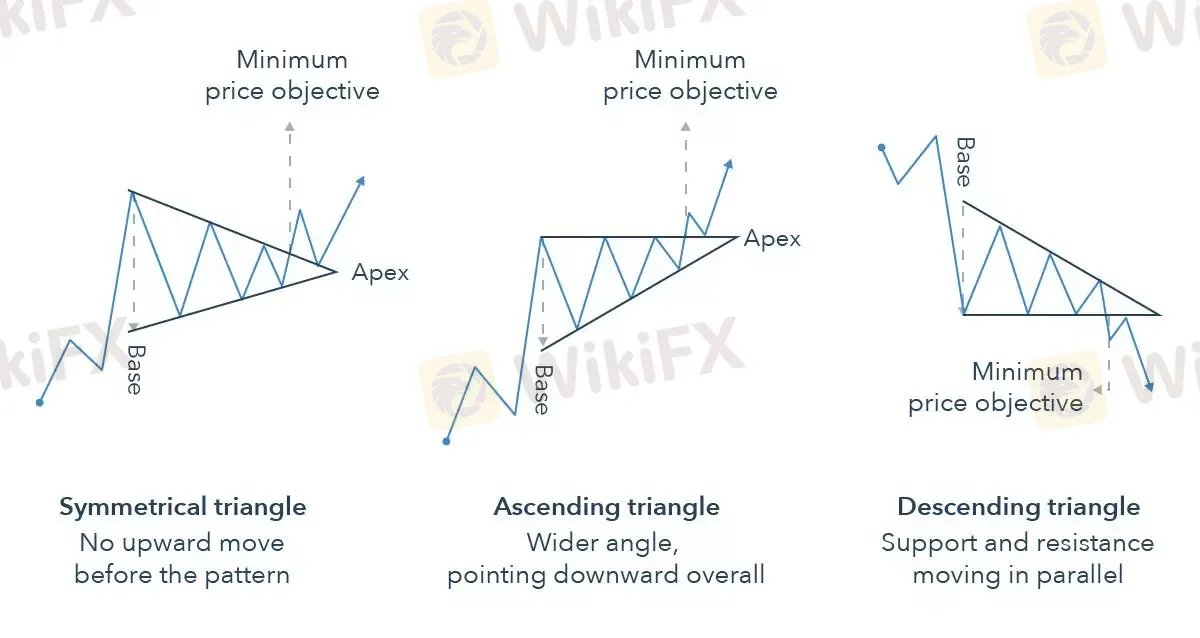
Continuation patterns signal that the current trend will continue after a brief consolidation or pullback. These patterns are crucial for traders who wish to stay with the prevailing trend.
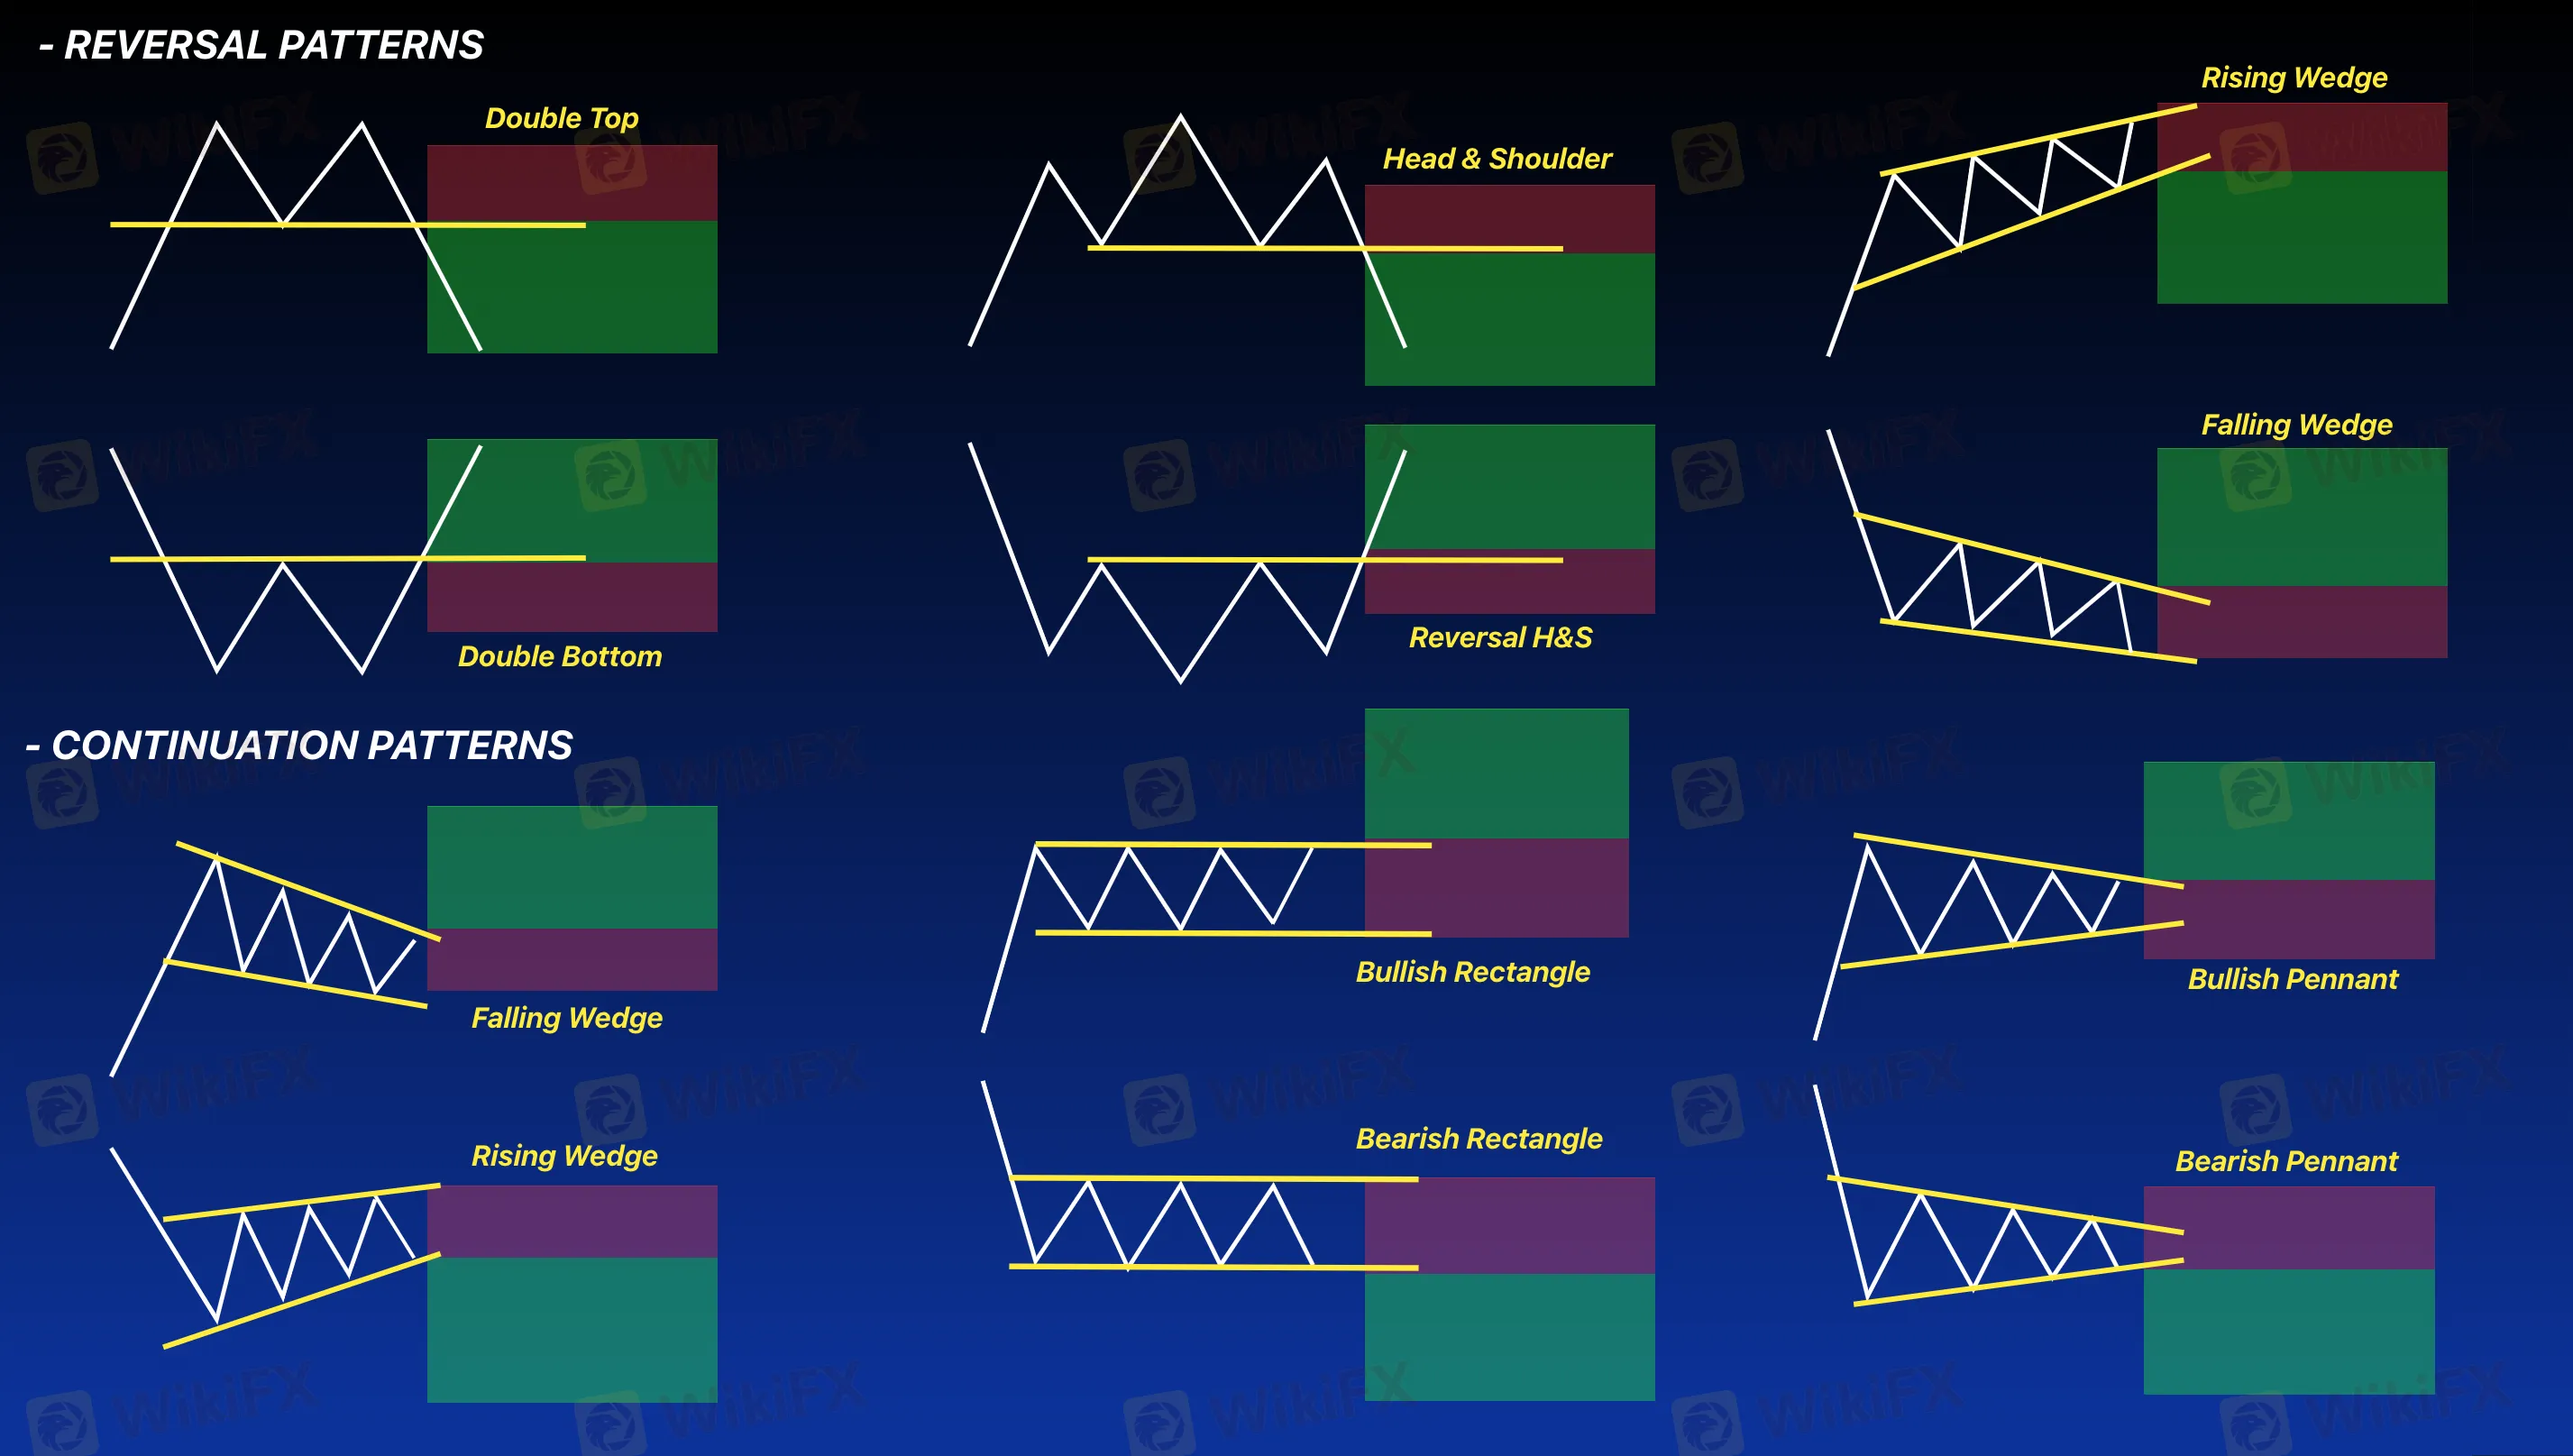
Reversal patterns indicate a potential change in the prevailing market trend. These patterns are especially valuable when traders anticipate a market reversal, whether it be from bullish to bearish or vice versa.
The formation of chart patterns is driven by the collective behavior of traders, and trader psychology plays a significant role in how these patterns emerge. By understanding the emotions that influence market decisions, traders can improve their ability to read chart patterns and make better decisions.
Fear and greed are the primary emotions that shape price movements in the forex market. Fear can cause traders to exit their positions prematurely, especially when the market moves against them. Conversely, greed can lead traders to take excessive risks, such as entering trades at unfavorable levels or holding onto positions for too long in the hope of greater profits.
For example, in the case of a double top, greed may push the price higher, forming the second peak, but once traders realize the market is turning, fear sets in, causing a sharp reversal and breaking the support level. Recognizing these emotional responses can help traders avoid acting impulsively and make more rational decisions.
Traders often have a tendency to seek out chart patterns that confirm their pre-existing beliefs about the market. This confirmation bias can lead to misinterpretation of patterns, especially if a trader is looking for a particular signal that fits their narrative. To avoid this, traders should maintain objectivity when analyzing charts and confirm their observations with other technical indicators and market factors.
Patience and discipline are essential traits for successful forex traders. Chart patterns often take time to develop, and traders must be patient before acting on the signals they provide. Entering a trade too early can lead to false breakouts or missed opportunities. Similarly, traders must exercise discipline by sticking to their trading plan and avoiding emotional decision-making based on incomplete patterns.
Even experienced traders can make mistakes when interpreting chart patterns. Below are some common errors and how to avoid them:
Chart patterns should be used in conjunction with other technical analysis tools. Traders who rely solely on chart patterns may miss important signals from other indicators like moving averages, RSI, or MACD. Combining multiple tools provides a more complete picture of the market.
Volume is a critical component of chart patterns. A pattern that forms without adequate volume is less likely to lead to a successful breakout. Volume confirms the strength of a price move, and traders should always look for volume spikes when trading chart patterns like triangles or head and shoulders.
One of the biggest mistakes traders make is acting on a chart pattern before it‘s fully confirmed. A head and shoulders pattern, for example, isn’t complete until the price breaks the neckline. Rushing into a trade can lead to losses if the pattern turns out to be a false signal.
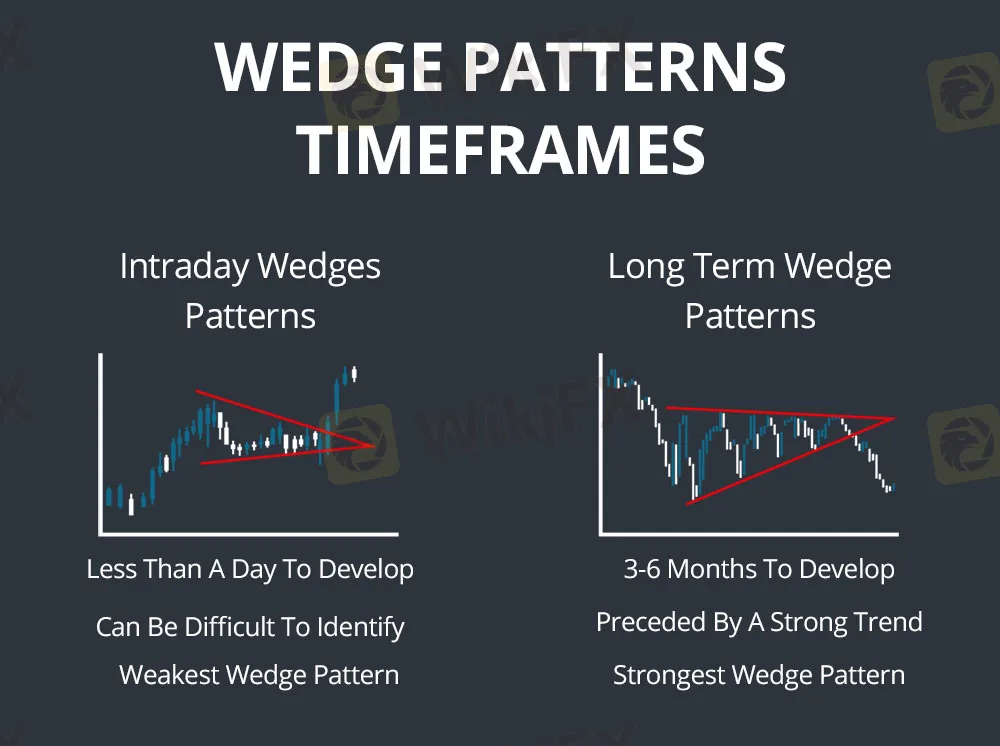
Not all chart patterns are equally reliable. Patterns that form after a strong trend tend to be more reliable than those that form during periods of sideways movement or indecision. Understanding the context of the pattern is essential to assessing its reliability.
Recognizing profit signals in chart patterns can help traders enter trades at the optimal time. These signals can include breakouts, trend reversals, or target="_blank" kwlink="6384064000816950219725">target="_blank" kwlink="6384064001486602547789">momentum shifts, all of which provide valuable opportunities to profit in the forex market.
Breakouts signal the continuation of a trend, and identifying them early can lead to profitable trades. For example, when a price breaks out of a triangle or flag pattern, it often signals that the market is ready to continue in the direction of the previous trend. Traders can enter the market as soon as the breakout is confirmed, typically with a strong close outside the pattern and a surge in volume.
Using chart patterns to set stop-loss and take-profit levels is a key aspect of managing risk. For example, after a head and shoulders pattern, traders can set their stop-loss just above the right shoulder and their profit target by measuring the height of the head and projecting it downward from the neckline. Similarly, in a triangle pattern, traders can measure the height of the pattern and use it to set their profit target once the price breaks out.
Effective risk management is crucial when trading forex chart patterns. Traders should always set stop-loss orders to protect their capital in case the market moves against them. By using chart patterns to determine logical stop-loss placements and setting profit targets, traders can manage their risk effectively and maximize their potential for success.
Forex chart patterns are indispensable tools for traders who wish to succeed in the competitive and fast-paced world of currency trading. Understanding and interpreting these patterns allows traders to make informed decisions based on market conditions and trends. Whether youre using continuation patterns like triangles and flags, or reversal patterns like head and shoulders and double tops, chart patterns provide valuable insights into future price movements.
However, chart patterns should not be relied on in isolation. Successful forex trading requires a combination of technical analysis, trader psychology, discipline, and risk management. By recognizing common mistakes, avoiding emotional trading decisions, and using patterns in conjunction with other tools, traders can increase their chances of profitability and minimize risk.
Mastering forex chart patterns is a continuous learning process, and with the right knowledge and approach, traders can build successful trading strategies that take full advantage of the forex markets potential.

Disclaimer:
The views in this article only represent the author's personal views, and do not constitute investment advice on this platform. This platform does not guarantee the accuracy, completeness and timeliness of the information in the article, and will not be liable for any loss caused by the use of or reliance on the information in the article.

India's Q1 FY27 GDP grew 7.8%, beating a 7.4% poll and RBI's 7.0% projection. See three conditional scenarios for INR, rates and gold.

Choosing a forex liquidity provider is not a search for the lowest displayed spread or the longest provider list. It is a broker decision about pricing integrity, depth, routing, credit, reporting, incident response, and client communication. This 2026 guide explains how a forex LP, FX liquidity provider, or liquidity provider forex arrangement fits into a broker’s execution chain; what to test before onboarding; why a “best forex liquidity provider” claim cannot replace due diligence; and how to compare cost beyond commission. Use the execution-quality scorecard, provider questions, routing scenarios, and 90-day onboarding plan to assess whether a liquidity relationship can support your actual client mix, instruments, risk model, and jurisdiction. The goal is not to make a universal ranking. It is to build evidence that your broker can explain, supervise, reconcile, and recover its execution service when market conditions are difficult.
The visible fee in an MT4 white label proposal is rarely the real cost of operating it. For an existing broker, the decision is not simply whether an MT4 white label platform is “cheap” or “expensive.” The real question is whether the commercial model remains viable after integration, support, data, client migration, compliance, and exit costs are included. That is why an MT4 white label cost review should be built as a 24- to 36-month operating case. It should compare three credible choices: 1. Keep the present MT4 setup and improve its weakest controls. 2. Replace the MT4 white label provider but retain the client proposition. 3. Migrate selected clients or products to another platform while running MT4 in parallel. This guide explains how to build that case without relying on headline prices or generic vendor claims.

Withdrawal delays are precisely the complaint we keep receiving on WikIFX, a veteran in the forex regulation inquiry space. While some users receive withdrawal access initially and find rejections on their applications later, some fail to receive a single approval. Some delays usually result from genuine compliance requirements that brokers need to adhere to. However, in many cases, traders have accused the broker of repeated excuses as part of its alleged strategy to deny a seamless fund release. A pending withdrawal cannot be an outright indicator of fraudulent activity. Financial institutions, including forex brokerage entities, need to abide by the anti-money laundering (AML) and Know Your Customer (KYC) regulations. However, as the monitoring process stretches beyond weeks or months, traders become frustrated and raise questions over the broker’s reliability.
WikiFXWikiFXWikiFXWikiFXWikiFXWikiFX