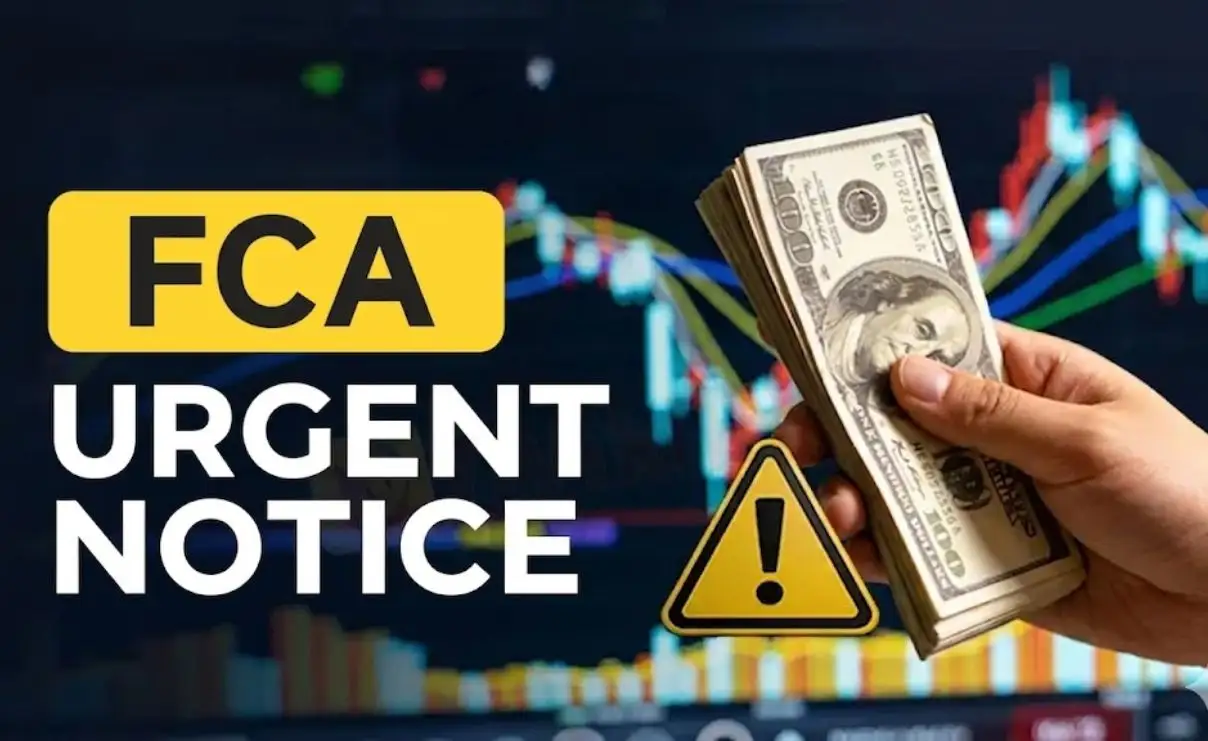
FCA-Regulated Forex Brokers Are Declining — 31 Platforms to Avoid
As of December 1, 2025, a total of 105 companies in the United Kingdom held CFD licences.
Original
简体中文
繁體中文
English
Pусский
日本語
ภาษาไทย
Tiếng Việt
Bahasa Indonesia
Español
हिन्दी
Filippiiniläinen
Français
Deutsch
Português
Türkçe
한국어
العربية

Abstract:The recent increase in natural gas prices suggests a potential recovery, but setbacks are possible. Factors include reduced Canadian gas exports due to wildfires, lower wind power generation, and decreased drilling activity. Technical analysis indicates resistance levels and diminishing downward pressure. Maintaining support above 2.03 is crucial for sustained upward movement.

The recent surge in momentum observed in the natural gas market could indicate the beginning of a potential recovery after a prolonged period of weakness. However, it is important to note that the decline experienced over the past year suggests that any upward movement in prices might be accompanied by setbacks, rather than a continuous rise. One of the factors contributing to the recent boost in natural gas prices is the reduced gas exports from Canada, primarily caused by wildfires in Alberta and other western provinces. Additionally, the decrease in wind power generation last week led to higher utilization of natural gas for electricity production, further supporting the prices.
Furthermore, the decline in drilling activity due to oversupply conditions and stricter credit conditions makes it less likely for natural gas prices to experience a significant further decline. The United States Energy Information Administration's Short-term Energy Outlook anticipates that the U.S. natural gas spot price will increase towards 3.71 by December.
Natural Gas Daily Chart
.png")
From a technical analysis perspective, natural gas is currently attempting to surpass a crucial resistance level at the April high of 2.52, which aligns with the upper boundary of the Ichimoku channel on the daily charts. A successful breakout above this level could potentially pave the way for further upward movement toward the March high of 3.03. However, it should be noted that overcoming this level might prove challenging, at least initially.
.png")
On the whole, the downward pressure on natural gas prices seems to be diminishing, as suggested by the color-coded candlestick charts that utilize trending and momentum indicators. Moreover, market diversity has been at exceptionally low levels, indicating a potential shift in market dynamics. These observations are consistent with the analysis presented in the articles titled “Natural Gas Price Setup: Downward Pressure is Abating,” published on April 11, and “Natural Gas Price Rebound Could Extend; What's Next for Crude Oil?” published on May 18.
Natural Gas Monthly Chart
.png")
To maintain the short-term upward pressure, it is crucial for natural gas prices to remain above the support level established in early May at 2.03. A decline below this support level would increase the risk of a renewed downward movement in prices.
Note: The color-coded chart mentioned in the article is designed to visually represent the prevailing trend in natural gas prices. Blue candles indicate a bullish phase, red candles indicate a bearish phase and grey candles represent consolidation phases that can occur within both bullish and bearish trends, sometimes appearing towards the end of a trend. It should be noted that the candle color is not predictive and may change in the subsequent bar. False patterns can also occur around the 200-period moving average, support/resistance levels, and in sideways or choppy markets. The author does not guarantee the accuracy of the information provided, and past performance should not be considered indicative of future performance. Users should exercise caution and make their own decisions when using this information, as they assume any associated risks.
Download and install the WikiFX App on your smartphone to stay updated on the latest news.
Download the App here: https://social1.onelink.me/QgET/px2b7i8n

Disclaimer:
The views in this article only represent the author's personal views, and do not constitute investment advice on this platform. This platform does not guarantee the accuracy, completeness and timeliness of the information in the article, and will not be liable for any loss caused by the use of or reliance on the information in the article.
As of December 1, 2025, a total of 105 companies in the United Kingdom held CFD licences.
Has Dbinvesting failed to honor your fund withdrawal requests? Did you notice that the broker remained fine when you were losing and turned worse as your numbers gained on the Dbinvesting login? Did the broker wipe out your profits and block your trading account? Many such allegations from users across India, the US and other regions have become headlines on broker review platforms such as WikiFX. To make it comprehensive, we have prepared an in-depth investigation report into user allegations, the company’s products and services, and, importantly, regulatory status, in this Dbinvesting review article.
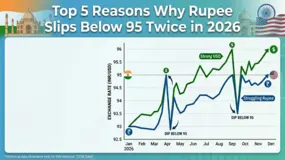
Times are tough for the rupee as it again slipped to 95 against the USD towards the end of April 2026 after some gains due to the RBI-led interventions early this month. The depreciation is largely attributable to surging crude oil prices. The prices climbed to their 3-year high over the US-Iran conflict. On April 30, 2026, the rupee opened at 95.02 mark against the USD, sliding 0.2% from its previous day’s ending at 94.84 against the greenback. As the day progressed, it slipped further to a new record low of 95.32 against the USD, beating the earlier fall of 95.22 in March 2026.
When you ask, "Is AssetsFX legit?", you're asking an important question about keeping your funds safe. After looking at all the available information, the answer is concerning: AssetsFX shows serious risks that traders should worry about. Our research found multiple problems that can't be overlooked. WikiFX, a website that checks brokers worldwide, gives AssetsFX only 2.44 points out of 10. They also warn users: "Low score, please stay away!" This very low rating isn't random. It comes from two main problems: the company doesn't have proper licenses from respected authorities, and many users have complained about losing funds. This article will explain the evidence behind this rating, giving you the facts you need to make a smart choice and protect your investments.
 WikiFXWikiFXWikiFXWikiFXWikiFXWikiFXWikiFXWikiFXWikiFXWikiFX
