
Broker Globale Piattaforma di Verifica Regolamentare
WikiFX
Italiano
简体中文
繁體中文
English
Pусский
日本語
ภาษาไทย
Tiếng Việt
Bahasa Indonesia
Español
हिन्दी
Filippiiniläinen
Français
Deutsch
Português
Türkçe
한국어
العربية
اردو

FPG USOUSD Market Report June 4, 2026
Sommario:On the M30 timeframe chart, USOUSD has recently experienced a strong bullish recovery, advancing from the 92.01 support area toward the 98.72 resistance zone and forming a consistent ascending channel
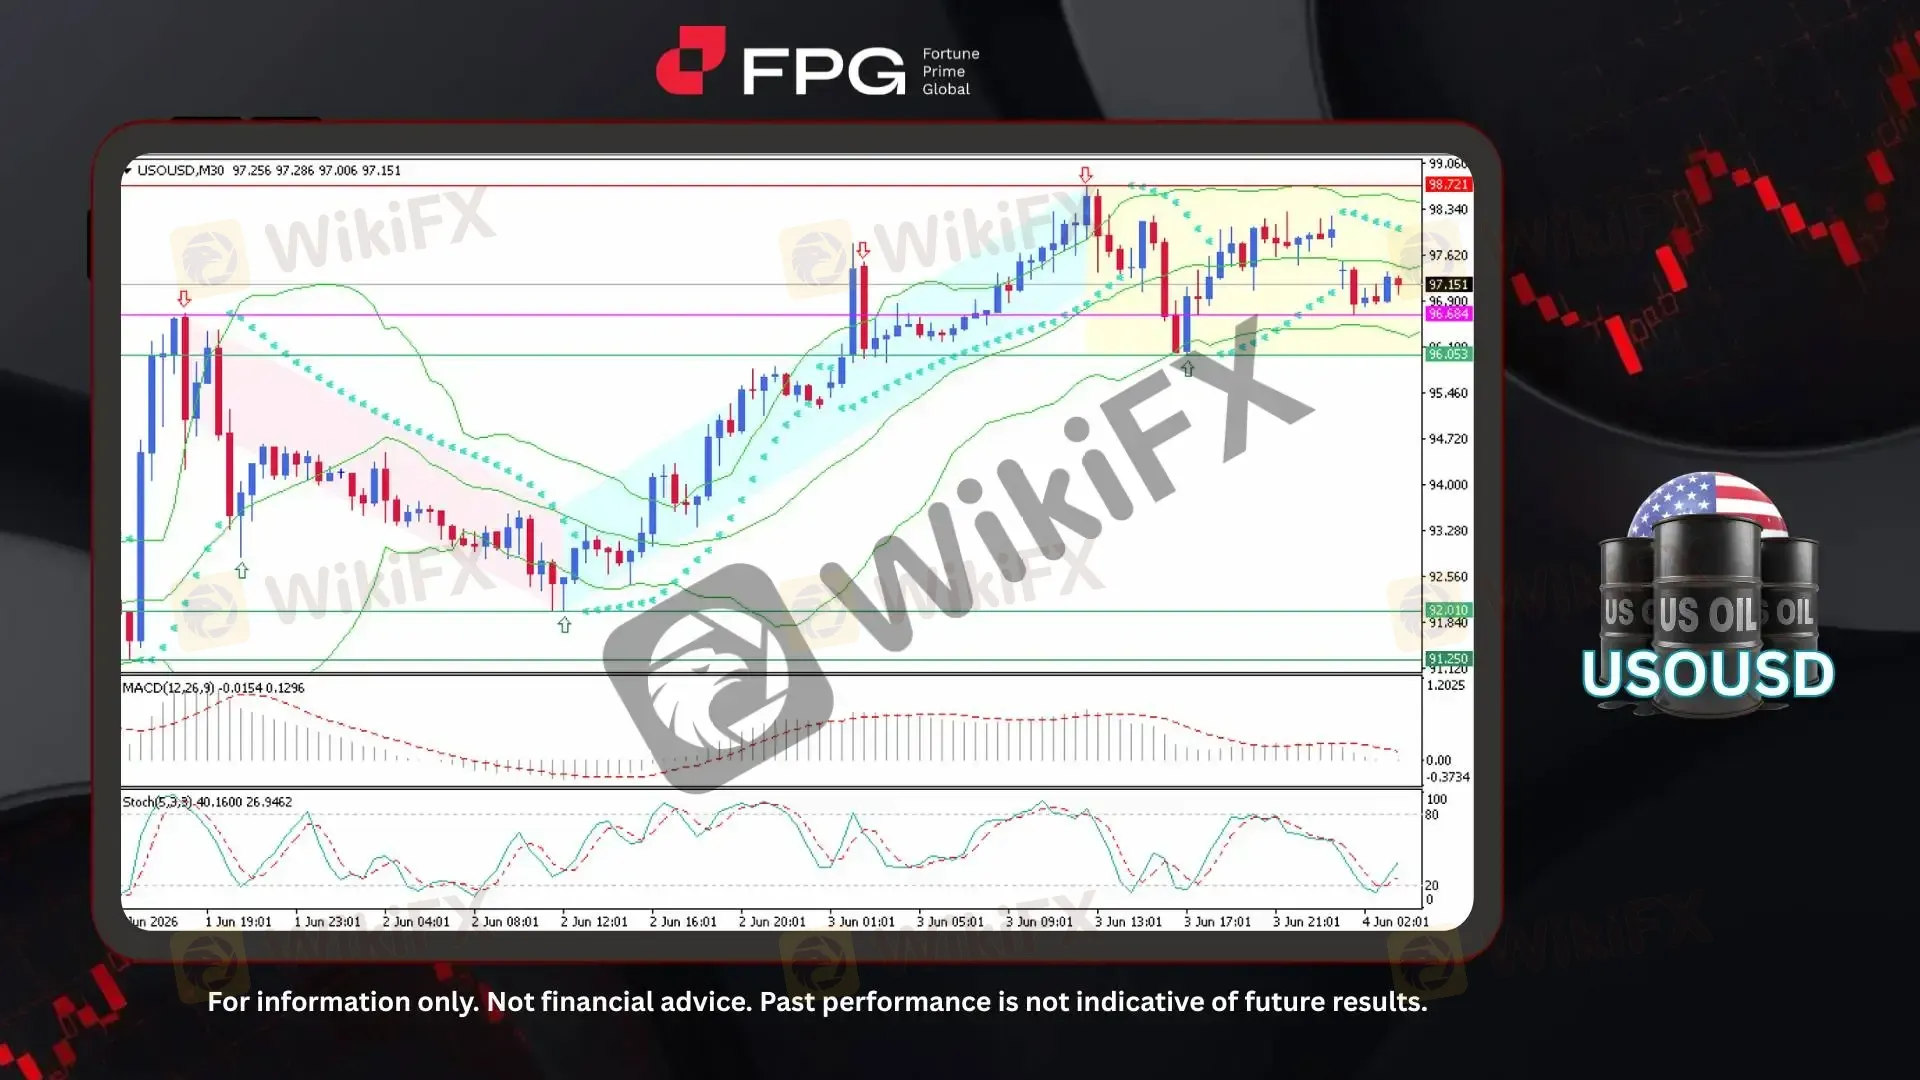
On the M30 timeframe chart, USOUSD has recently experienced a strong bullish recovery, advancing from the 92.01 support area toward the 98.72 resistance zone and forming a consistent ascending channel structure. Previously, the market went through a bearish phase, declining from around 96.68 before finding support at 92.01, where buying pressure emerged and triggered a trend reversal. Following the recovery, price continued moving higher with a series of higher highs and higher lows, although the latest movement shows signs of consolidation near the upper channel boundary. The current price is trading around 97.15 with moderate volatility, indicating that the market is currently stabilizing after the strong bullish expansion.
From a technical perspective, USOUSD remains in a bullish structure after successfully recovering from the previous decline and maintaining movement within the ascending channel. Bollinger Bands remain expanded, reflecting elevated volatility during the recent rally. The MACD (12,26,9) shows weakening momentum, with the MACD Line remaining below the Signal Line at approximately -0.0154 and 0.1296 respectively, indicating that bullish momentum has moderated and the market may continue consolidating in the short term. Meanwhile, the Stochastic Oscillator (5,3,3) is currently around 40.16 and 26.94, showing a recovery from lower levels but still indicating that momentum has not fully returned to strong bullish conditions. Overall, indicators suggest that the bullish structure remains intact, although short-term momentum is stabilizing.
Global oil markets continue to be influenced by supply-side concerns, geopolitical developments, and expectations regarding future energy demand. Recent inventory data and ongoing risks of supply disruption have supported crude oil prices, while market participants continue monitoring production policies and global economic conditions. Although concerns over economic growth remain a factor, persistent supply uncertainty has provided support for oil prices and helped maintain positive sentiment toward USOUSD. However, traders should remain cautious as upcoming economic releases, energy market data, and geopolitical developments may create additional volatility.
Technical Market Overview
1. Current Position: USOUSD is currently trading around 97.15 after recovering strongly from the 92.01 support area. Recent sideways movement near the upper area suggests that the market is experiencing temporary consolidation after the previous bullish rally.
2. Resistance Zone: Immediate resistance is located around 98.72, which represents the latest swing high and the upper boundary of the previous bullish structure. A confirmed breakout above this level could resume bullish continuation and open the possibility toward higher price levels.
3. Support Zone: Nearest support is identified at 96.68, which aligns with the previous resistance area and short-term structure support after the recent recovery. A deeper support zone lies around 92.01, representing the major base where the bullish reversal started.
4. Indicator Observation: Technical indicators continue showing a cautiously bullish outlook. Bollinger Bands remain expanded, reflecting active volatility. The MACD (12,26,9) shows weakening momentum with a reading around -0.0154 / 0.1296, suggesting a possible slowdown in the short term. Meanwhile, the Stochastic Oscillator (5,3,3) at 40.16 and 26.94 indicates improving momentum after a decline but remains below stronger bullish levels.
5. Technical Summary: Overall, USOUSD has entered a consolidation phase following its bullish rally. However, the current consolidation near 98.72 resistance indicates that buyers may need stronger momentum to continue the rally. A confirmed breakout above 98.72 would support further bullish continuation, while rejection from this resistance zone could trigger a corrective movement toward 96.68 support.
Market Performance:
Commodities Last Price % Change
UKOUSD 98.98 −0.96%
Today's Key Economic Calendar:
US: Fed Logan Speech
AU: Balance of Trade
AU: RBA Gov Bullock & Kent Speeches
EU: ECB President Lagarde Speech
UK: S&P Global Construction PMI
EU: Retail Sales MoM
US: Fed Barkin Speech
US: Initial Jobless Claims
UK: BoE Gov Bailey Speech
Risk Disclaimer: This report is for informational purposes only and does not constitute financial advice. Investments involve risks, and past performance does not guarantee future results. Consult your financial advisor for personalized investment strategies.
Disclaimer:
Le opinioni di questo articolo rappresentano solo le opinioni personali dell’autore e non costituiscono consulenza in materia di investimenti per questa piattaforma. La piattaforma non garantisce l’accuratezza, la completezza e la tempestività delle informazioni relative all’articolo, né è responsabile delle perdite causate dall’uso o dall’affidamento delle informazioni relative all’articolo.
WikiFX Trader
eightcap
Sotto supervisione
EBC FINANCIAL GROUP
Sotto supervisione
TICKMILL
Sotto supervisione
D prime
Supervisione del paese
FXTM
Sotto supervisione
JustMarkets
Sotto supervisione
eightcap
Sotto supervisione
EBC FINANCIAL GROUP
Sotto supervisione
TICKMILL
Sotto supervisione
D prime
Supervisione del paese
FXTM
Sotto supervisione
JustMarkets
Sotto supervisione
Rate Calc
USD

CNY
Tasso di cambio attuale:0
inserisci l'importo
USD
A disposizione
CNY
Calcolare 