
Applicazione di richiesta di informazioni sulla regolamentazione dei broker globali
WikiFX
English
简体中文
繁體中文
English
Pусский
日本語
ภาษาไทย
Tiếng Việt
Bahasa Indonesia
Español
हिन्दी
Filippiiniläinen
Français
Deutsch
Português
Türkçe
한국어
العربية
Gold Turns Bullish Only If It Breaks Above $4,150; Otherwise Expect Sideways Consolidation
Sommario:With no major bearish catalysts in sight, current market risk appetite does not fundamentally support a sustained rally in precious metals. However, short-term trading still requires close attention t
With no major bearish catalysts in sight, current market risk appetite does not fundamentally support a sustained rally in precious metals. However, short-term trading still requires close attention to technical signals. Both the U.S. Dollar Index and the 10-year Treasury yield declined simultaneously, providing support for equities, non-USD currencies, and precious metals.
Sentiment indicators also remain favorable. The CNN Fear & Greed Index is still sitting at “Extreme Fear,” reporting 16%. This keeps us comfortable with the ongoing rebound in risk assets and leaves room for the rally to extend into the Christmas season.
")
(Figure 1. CNN Fear & Greed Index; Source: CNN)
The U.S. 10-year Treasury yield briefly broke below 4.00% during yesterdays U.S. session. Beyond the September Producer Price Index (PPI) cooling in line with expectations, retail sales data came in weaker-than-expected, prompting renewed market expectations for a December Fed rate cut.
Additionally, San Francisco Fed President Mary Daly stated on the 24th that the risk of a sudden deterioration in the labor market is higher—and more difficult to control—than the risk of inflation flaring up again. She argued that a rate cut in December would be appropriate. Daly emphasized that nonlinear risks exist in today‘s labor market but expressed confidence that inflation can return to the Fed’s 2% target without causing a meaningful rise in unemployment.
")
(Figure 2. U.S. 10-Year Treasury Yield; Source: CNBC)
From our perspective, the 10-year yield falling below 4.00% carries symbolic importance: it signals optimism regarding future borrowing costs and suggests investors are regaining confidence in U.S. Treasuries. This should benefit small-to-medium-sized businesses and households by lowering financing costs. It also reflects a degree of market self-reinforcement, supporting stronger terminal demand and consumption in the months ahead.
Following the release of September retail sales, overall business inventories continued to decline in August. The inventory-to-sales ratio held steady at 1.37, consistent with July. With inventories as the numerator and sales as the denominator, this indicates that terminal demand in the U.S. was indeed softer than July. However, these figures represent lagging data. The U.S. is now entering the traditional fourth-quarter shopping season, and we expect firms to actively rebuild inventories, potentially lifting manufacturing momentum.
")
(Figure 3. Business Inventories & Inventory-to-Sales Ratio; Source: FRED)
As U.S. earnings season winds down, Novembers healthy pullback in equities combined with upward earnings revisions has led to a constructive reset in market valuations. This prevents excessive P/E expansion and currently forms an ideal setup for a continued U.S. equity bull cycle.
")
(Figure 4. Forward 12-Month P/E Ratio; Source: FactSet)
Gold Technical Outlook
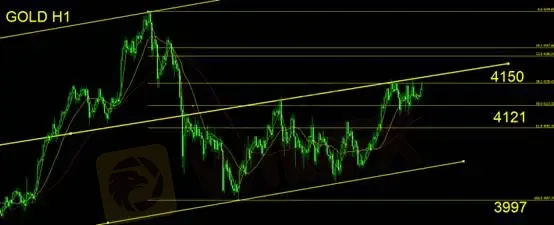
Gold has reached a critical resistance zone, encountering selling pressure at the upper boundary of its ascending channel and the 61.8% Fibonacci retracement at $4,150. The trend is becoming clearer:
A breakout above $4,150 opens the door for long opportunities, with the potential to retest prior highs.
Failure to break $4,150 suggests a return to range-bound trading, where short-term short positions may be considered.
Key support lies at $4,121, with secondary support at $3,997.
Stop-loss recommendation: $15
Support: 4,121 / 3,997
Resistance: 4,150
Risk Disclaimer
The views, analysis, research, pricing, or other information presented above constitute general market commentary and do not represent the official position of this platform. All readers should exercise independent judgment and assume full responsibility for their trading decisions.
Disclaimer:
Le opinioni di questo articolo rappresentano solo le opinioni personali dell’autore e non costituiscono consulenza in materia di investimenti per questa piattaforma. La piattaforma non garantisce l’accuratezza, la completezza e la tempestività delle informazioni relative all’articolo, né è responsabile delle perdite causate dall’uso o dall’affidamento delle informazioni relative all’articolo.
WikiFX Trader
XM
Sotto supervisione
Plus500
Sotto supervisione
EC markets
Sotto supervisione
HFM
Sotto supervisione
STARTRADER
Sotto supervisione
TMGM
Sotto supervisione
XM
Sotto supervisione
Plus500
Sotto supervisione
EC markets
Sotto supervisione
HFM
Sotto supervisione
STARTRADER
Sotto supervisione
TMGM
Sotto supervisione
Rate Calc
USD

CNY
Tasso di cambio attuale: 0
inserisci l'importo
USD
A disposizione
CNY
Calcolare