
Applicazione di richiesta di informazioni sulla regolamentazione dei broker globali
WikiFX
English
简体中文
繁體中文
English
Pусский
日本語
ภาษาไทย
Tiếng Việt
Bahasa Indonesia
Español
हिन्दी
Filippiiniläinen
Français
Deutsch
Português
Türkçe
한국어
العربية
Nvidia Announces $60 Billion Stock Buyback as Q2 Revenue Tops Expectations
Sommario:Nvidia, often regarded as one of the most influential companies driving technological progress in the 21st century, reported fiscal Q2 2026 revenue of $46.7 billion, beating market expectations of $46
Nvidia, often regarded as one of the most influential companies driving technological progress in the 21st century, reported fiscal Q2 2026 revenue of $46.7 billion, beating market expectations of $46.0 billion. The company also unveiled an ambitious $60 billion share repurchase program. Despite these bullish announcements, Nvidias stock fell more than 3% in after-hours trading.
For the next quarter, Nvidia guided revenue of $54 billion, but this projection excludes potential sales of its H20 chips to China. Concerns over a possible slowdown in Chinese demand, coupled with questions about whether AI may be entering bubble territory, weighed on investor sentiment after hours.
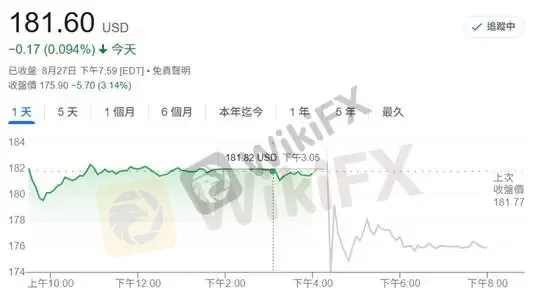
(Figure 1: Nvidia share price performance after earnings release; Source: Google Finance)
Regardless of short-term market swings, we prefer to evaluate industry trends through a mid- to long-term lens, which we believe helps cultivate a more resilient investment mindset.
1. Policy Support
The latest “Only Big and Beautiful Bill” (OBBB) under the Trump administration offers substantial tax incentives, including accelerated depreciation and full expensing of R&D costs. These measures are expected to significantly improve cloud service providers (CSPs) free cash flow (FCF), thereby boosting their willingness to expand 2026 CAPEX.
This is exactly why we consistently emphasize to investors that once favorable policies are in place, the industry tailwinds cannot be easily reversed. While stock prices may fluctuate due to external factors, the long-term growth trajectory of AI infrastructure remains clear.
Given the generous investment tax credits embedded in the OBBB, we expect robust CSP capital expenditures in 2026 to support continued AI server procurement. From our perspective, the AI sector is not in a bubble phase at this stage.
2. From Enterprise Adoption to Consumer Applications
Historically, the commercialization of breakthrough technologies follows a familiar path: from laboratory research, to enterprise deployment, and finally to mass consumer adoption—a cycle that typically spans a decade or more. Put simply, much of todays technology originates from research done 30 years ago.
Currently, both U.S. and Chinese CSPs are aggressively expanding capital spending, laying the groundwork for future consumer adoption. As the late Steve Jobs once noted, “A great product makes people lazier”—underscoring how supply often drives consumer demand.
We view todays subdued consumer demand as a short-term phenomenon, exacerbated by lower disposable incomes and savings rates. When equity markets rise to exuberant levels, irrational behavior tends to follow. Conversely, when markets decline and fears of recession intensify, pessimism can appear endless.
By analyzing both human psychology and macroeconomic cycles, we recognize that while asset prices lack a clear trend at present—creating a difficult trading environment—this very uncertainty sets the stage for future opportunities.
Our core theme for Q3 remains: Stay Alive.
Gold Technical Analysis
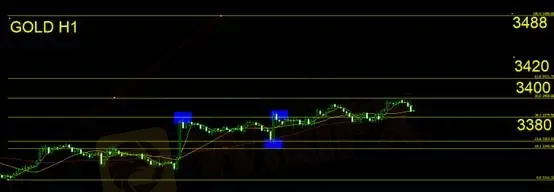
Gold extended its short-term rebound momentum, with higher highs and intact higher lows. Using Fibonacci retracement levels, yesterday‘s pullback to $3,380/oz held firm before reversing upward, with resistance encountered around $3,400/oz. During today’s Asian session, prices retreated again, making $3,373 (yesterdays intraday low) a key support level. As long as this level holds, the bullish structure remains intact. Short-term traders should maintain a long bias, with protective stops set just below $3,372.
Support: $3,380
Resistance: $3,400 / $3,420 / $3,488
Risk Disclaimer: The above views, analysis, research, prices, or other information are provided as general market commentary and do not represent the position of this platform. All readers are responsible for their own trading decisions. Please exercise caution.
Disclaimer:
Le opinioni di questo articolo rappresentano solo le opinioni personali dell’autore e non costituiscono consulenza in materia di investimenti per questa piattaforma. La piattaforma non garantisce l’accuratezza, la completezza e la tempestività delle informazioni relative all’articolo, né è responsabile delle perdite causate dall’uso o dall’affidamento delle informazioni relative all’articolo.
WikiFX Trader
FXTM
Sotto supervisione
Ultima
Sotto supervisione
AVATRADE
Sotto supervisione
IC Markets Global
Sotto supervisione
STARTRADER
Sotto supervisione
Plus500
Sotto supervisione
FXTM
Sotto supervisione
Ultima
Sotto supervisione
AVATRADE
Sotto supervisione
IC Markets Global
Sotto supervisione
STARTRADER
Sotto supervisione
Plus500
Sotto supervisione
Rate Calc
USD

CNY
Tasso di cambio attuale: 0
inserisci l'importo
USD
A disposizione
CNY
Calcolare