
Applicazione di richiesta di informazioni sulla regolamentazione dei broker globali
WikiFX
English
简体中文
繁體中文
English
Pусский
日本語
ภาษาไทย
Tiếng Việt
Bahasa Indonesia
Español
हिन्दी
Filippiiniläinen
Français
Deutsch
Português
Türkçe
한국어
العربية
Liquidity Drains Intensify Market Volatility
Sommario:High-frequency indicators of market liquidity include the Federal Reserves Overnight Reverse Repo Program (ONRRP) and the U.S. Treasury General Account (TGA). The ONRRP reflects idle cash parked at th
High-frequency indicators of market liquidity include the Federal Reserves Overnight Reverse Repo Program (ONRRP) and the U.S. Treasury General Account (TGA). The ONRRP reflects idle cash parked at the Fed to earn interest, currently standing at just $22 billion.
As the U.S. government issues short-term Treasury bills and bonds, idle funds have shifted toward the higher-yielding Treasury market. Meanwhile, the Treasurys account balance has climbed toward $520 billion. This rising flow suggests liquidity is being drained from the market via government debt issuance, driving capital to chase efficiency.
(Figure 1: ONRRP Balances; Source: MacroMicro)
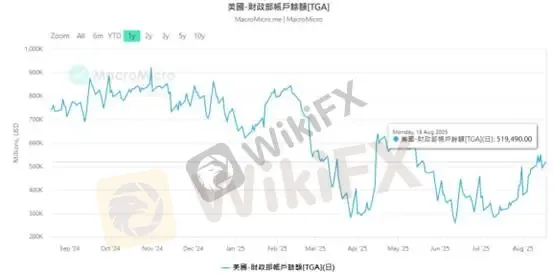
(Figure 2: Treasury General Account Balance; Source: MacroMicro)
A key systemic risk factor for financial markets is the level of bank reserves. To absorb the Treasurys massive Q3 issuance, reserves are likely to decline. With rate-cut expectations strengthening and the economy stabilizing, longer-dated Treasury auctions should proceed smoothly.
As of last Thursday (August 14), the Feds balance sheet data showed bank reserves at $3.3 trillion.
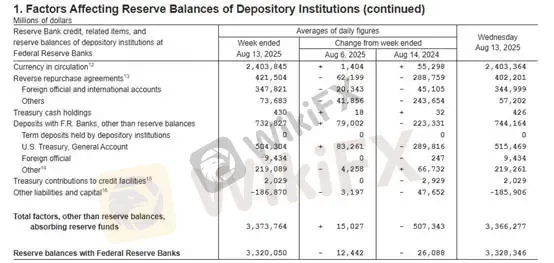
(Figure 3: Federal Reserve Balance Sheet; Source: Federal Reserve)
Will tighter liquidity trigger systemic risk?
We believe such speculation is inevitable. Put differently, the risk of a market correction will hinge on whether quantitative tightening (QT) is extended. With the Fed no longer purchasing assets and the Treasury raising cash levels, liquidity must be drained from banks.
As liquidity contracts, the Secured Overnight Financing Rate (SOFR) is expected to rise. Higher short-end rates increase volatility risk across financial markets. Currently, SOFR stands at 4.34%, while the ONRRP rate is 4.25%, indicating capital is being deployed more efficiently.
(Figure 4: SOFR Rate and Trading Volume; Source: NY Fed)
Compared with 2023, private interbank lending has tripled. Against this backdrop, we expect the Fed will not terminate QT in the short-to-medium term.
Precious Metals Outlook
Gold remains in a high-volatility range. Based on the macro backdrop outlined above, we remain confident in the U.S. dollars appreciation path. This reinforces a bearish bias for precious metals and highlights the downside risks for risk assets, all of which ultimately tie back to liquidity conditions.
Gold Technical Analysis
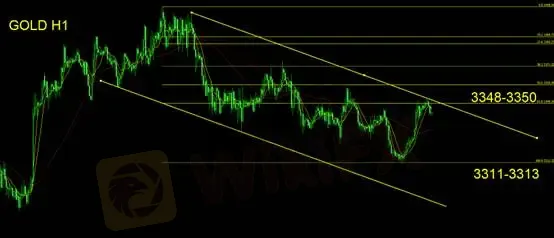
Gold tested support at 3311–3313 yesterday before rebounding toward 3350, corresponding to the 38.2% Fibonacci retracement level. On the hourly chart, the downtrend remains intact, with lower highs and lower lows. Short-term trading strategies remain unchanged: we suggest maintaining a neutral-to-bearish bias. A breakout above 3350 would warrant staying on the sidelines.
Support: 3311–3313
Resistance: 3348–3350
Disclaimer:
Le opinioni di questo articolo rappresentano solo le opinioni personali dell’autore e non costituiscono consulenza in materia di investimenti per questa piattaforma. La piattaforma non garantisce l’accuratezza, la completezza e la tempestività delle informazioni relative all’articolo, né è responsabile delle perdite causate dall’uso o dall’affidamento delle informazioni relative all’articolo.
WikiFX Trader
octa
Sotto supervisione
HFM
Sotto supervisione
ATFX
Sotto supervisione
Exness
Sotto supervisione
FXTM
Sotto supervisione
FOREX.com
Supervisione del paese
octa
Sotto supervisione
HFM
Sotto supervisione
ATFX
Sotto supervisione
Exness
Sotto supervisione
FXTM
Sotto supervisione
FOREX.com
Supervisione del paese
Rate Calc
USD

CNY
Tasso di cambio attuale: 0
inserisci l'importo
USD
A disposizione
CNY
Calcolare