
Applicazione di richiesta di informazioni sulla regolamentazione dei broker globali
WikiFX
English
简体中文
繁體中文
English
Pусский
日本語
ภาษาไทย
Tiếng Việt
Bahasa Indonesia
Español
हिन्दी
Filippiiniläinen
Français
Deutsch
Português
Türkçe
한국어
العربية
What Drives a Gold Bear Market?
Sommario:According to the World Gold Councils journal, a historical review of the past five gold bear markets highlights the key risks that could drive medium-term corrections in the future.Nov 1974 – Aug 1976
According to the World Gold Councils journal, a historical review of the past five gold bear markets highlights the key risks that could drive medium-term corrections in the future.
Nov 1974 – Aug 1976, return -43%; Reason: easing geopolitical risks
Aug 1980 – Jun 1982, return -52%; Reason: easing geopolitical and inflation risks
Jan 1983 – Feb 1985, return -57%; Reason: easing geopolitical and economic risks
Nov 1987 – Aug 1999, return -48%; Reason: central bank gold sales, increased supply
Aug 2011 – Dec 2015, return -42%; Reason: declining risks and weakening momentum
The study suggests that major gold corrections are largely linked to a rise in opportunity costs, particularly when real interest rates and the U.S. dollar strengthen.
At times, this is fueled by economic expansion; at others, by rapid Fed rate hikes. Higher opportunity costs and robust economic performance tend to dampen investor appetite for gold while boosting risk-on sentiment.
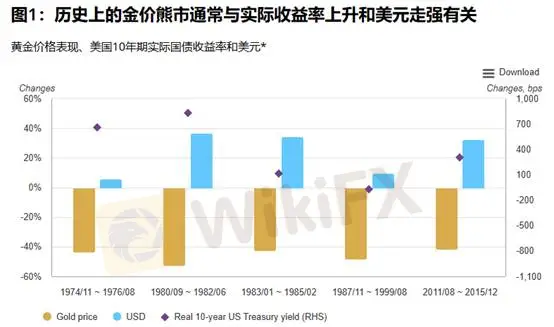
(Figure 1. Gold Drawdowns vs. Real Rates & USD; Source: World Gold Council)
Structural Shifts Since 2000
Since 2000, gold has only experienced one bear market, largely due to three structural shifts:
Strong economic expansion, with surging demand from emerging markets such as China and India.
A reversal in central bank behavior—from net sellers over two decades to net buyers after 2009, making a significant contribution to annual demand.
The creation and rapid growth of global gold ETFs, attracting a new wave of investors.
Scenarios for Long-Term Weakness
Central Bank Exit
If major buyers such as central banks were forced to liquidate reserves due to fiscal or economic crises, global trade contraction, or shrinking FX reserves, demand for gold could sharply decline—even turning negative. This would remove a critical layer of market support.
Cryptocurrency Boom
Should digital assets gain formal recognition from leading economies, with new regulatory frameworks driving institutional adoption, gold‘s role as a reserve asset could weaken. If the U.S. were to establish official crypto reserves, both investors and central banks could divert allocations away from gold.
Capital Market Liberalization
If countries like China and India fully open their capital markets, gold’s role as a global safe-haven asset may diminish. A generational shift in consumer preferences—where younger demographics lose interest in gold jewelry—would further weaken both investment and consumption demand.
Excess Supply from Major Discoveries
The discovery of large, economically viable gold deposits could trigger a supply surge. If production costs remain low and labor is concentrated, expanded supply could rebalance the market for decades.
Conclusion
Technical Analysis
If gold were to undergo a longer-lasting downturn, structural shifts like these would need to reverse. Simply put, a true gold bear market would most likely be driven by competition from alternative assets that better match evolving investor preferences.
From the current macro and industry perspective, the three largest gold miners have not significantly increased capital expenditures, instead maintaining a cautious stance despite higher prices. Meanwhile, market liberalization in major economies like India and China remains a long-term probability rather than an immediate threat.
Thus, we do not expect structural headwinds for gold at this stage. However, our bearish view is currently anchored on two key factors: the repatriation of U.S. dollars and the growing role of cryptocurrencies in global reserves.

Gold reversed downward from the $3,353–$3,355 resistance zone and broke below the $3,333–$3,335 support during todays Asian session, confirming that bearish momentum remains intact. Investors should continue to favor short positions.
For existing shorts: consider setting stop-loss at breakeven.
For new entries: initiate short positions in the $3,333–$3,335 range with a stop-loss of $15.
Support: $3,333–$3,335
Resistance: $3,353–$3,355 / $3,373–$3,374 / $3,398–$3,406
⚠ Risk Disclaimer
The above analysis, research, prices, and commentary are provided solely as general market insights and do not represent the stance of this platform. Market participants assume full responsibility for their investment decisions. Please trade with caution.
Disclaimer:
Le opinioni di questo articolo rappresentano solo le opinioni personali dell’autore e non costituiscono consulenza in materia di investimenti per questa piattaforma. La piattaforma non garantisce l’accuratezza, la completezza e la tempestività delle informazioni relative all’articolo, né è responsabile delle perdite causate dall’uso o dall’affidamento delle informazioni relative all’articolo.
WikiFX Trader
Plus500
Sotto supervisione
octa
Sotto supervisione
InteractiveBrokers
le lista nera
FXCM
Sotto supervisione
Vantage
Sotto supervisione
D prime
Sotto supervisione
Plus500
Sotto supervisione
octa
Sotto supervisione
InteractiveBrokers
le lista nera
FXCM
Sotto supervisione
Vantage
Sotto supervisione
D prime
Sotto supervisione
Rate Calc
USD

CNY
Tasso di cambio attuale: 0
inserisci l'importo
USD
A disposizione
CNY
Calcolare