
Applicazione di richiesta di informazioni sulla regolamentazione dei broker globali
WikiFX
English
简体中文
繁體中文
English
Pусский
日本語
ภาษาไทย
Tiếng Việt
Bahasa Indonesia
Español
हिन्दी
Filippiiniläinen
Français
Deutsch
Português
Türkçe
한국어
العربية

Consumer Spending Weakens, but Equities Hold Steady?
Sommario:U.S. retail sales for July rose 0.5% MoM, with June data revised up from 0.6% to 0.9%. On a yearly basis, sales increased 3.9%. While this headline growth appears moderate, real retail sales—adjusted
U.S. retail sales for July rose 0.5% MoM, with June data revised up from 0.6% to 0.9%. On a yearly basis, sales increased 3.9%. While this headline growth appears moderate, real retail sales—adjusted for inflation—fell from 1.63% to 1.15%, confirming that terminal demand has shifted from anticipated overspending to evident weakness.
")
(Chart 1. Retail Sales Data; Source: U.S. Census Bureau)
")
(Chart 2. Retail Sales Data; Source: Federal Reserve Economic Data)
Looking at the inventory-to-sales ratio across the upstream, midstream, and downstream supply chain, U.S. manufacturing inventories remain elevated, though a mild improvement in inventory buildup is visible. The overall business inventory-to-sales ratio fell to 1.38. Current risks lie mainly at the upstream level, while wholesale and retail inventory risk remains limited—consistent with our earlier commentary on the post-pandemic “new normal” for inventories.
")
(Chart 3. Inventory-to-Sales Ratio by Supply Chain; Source: MacroMicro)
Retailers continue to stock cautiously, implying that upstream and midstream demand still relies on urgent, short-term orders. This reflects the uncertain consumption outlook for the second half of the year.
In short: U.S. terminal demand has not collapsed, but neither has there been any significant rebound in essential spending.
Meanwhile, the University of Michigans August Consumer Sentiment Index showed a 5% decline, the first drop in four months.
Due to persistent inflation, durable goods buying conditions plunged 14%, hitting a one-year low. Concerns over purchasing power have weakened current household finances.
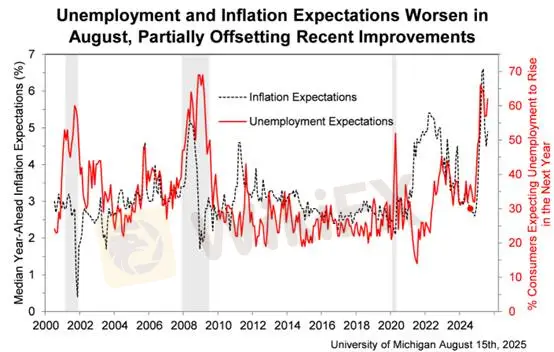
By contrast, expectations for future personal finances and incomes edged slightly higher, though sentiment remains subdued. Overall, consumers are no longer bracing for the “worst-case” scenario feared after reciprocal tariffs were announced in April, yet they still expect inflation and unemployment to deteriorate.

(Chart 4. Unemployment & Inflation Expectations; Source: University of Michigan Consumer Sentiment Survey)
From this report, the key takeaway is that “personal finances and income expectations” should be the main focus. Moreover, with oil prices still trending lower, this should be interpreted as a positive factor for household finances.
That said, equity valuations remain stretched, and weaker consumer momentum poses the biggest downside risk for stocks. While market liquidity has not yet triggered a macro risk, Q3 is likely to be tougher to navigate than Q2. Traders should slow their pace, watch more, and act less.
Gold Technical Analysis
In Asian trading, gold dipped before rebounding, but overall remains in a sideways consolidation range rather than in a clear downtrend. However, the weekly chart has confirmed a bearish engulfing pattern, overlapping with an evening star formation, signaling that short positions are favored. No strong rebound opportunities are present for now.
Intraday resistance: 3533–3555 (sell if price fails to break higher, stop-loss at $15)
Support levels: 3333–3335
Resistance levels: 3353–3355 / 3373–3374 / 3398–3406
Short positions: Hold with stops at $20
Risk Disclaimer: The views, analyses, research, prices, or other information above are for general market commentary only and do not represent the stance of this platform. All readers should manage their own risk responsibly.
Disclaimer:
Le opinioni di questo articolo rappresentano solo le opinioni personali dell’autore e non costituiscono consulenza in materia di investimenti per questa piattaforma. La piattaforma non garantisce l’accuratezza, la completezza e la tempestività delle informazioni relative all’articolo, né è responsabile delle perdite causate dall’uso o dall’affidamento delle informazioni relative all’articolo.
WikiFX Trader
XM
Sotto supervisione
FOREX.com
Supervisione del paese
Ultima
Sotto supervisione
GTCFX
Sotto supervisione
octa
Sotto supervisione
InteractiveBrokers
le lista nera
XM
Sotto supervisione
FOREX.com
Supervisione del paese
Ultima
Sotto supervisione
GTCFX
Sotto supervisione
octa
Sotto supervisione
InteractiveBrokers
le lista nera
Rate Calc
USD

CNY
Tasso di cambio attuale: 0
inserisci l'importo
USD
A disposizione
CNY
Calcolare