
Applicazione di richiesta di informazioni sulla regolamentazione dei broker globali
WikiFX
English
简体中文
繁體中文
English
Pусский
日本語
ภาษาไทย
Tiếng Việt
Bahasa Indonesia
Español
हिन्दी
Filippiiniläinen
Français
Deutsch
Português
Türkçe
한국어
العربية
U.S. July PPI Data Dampens Rate Cut Hopes, Dollar Index Surges
Sommario:The U.S. Producer Price Index (PPI) for July rose 0.9% MoM and 3.3% YoY, with both final demand services and goods facing upward pressure from rising raw material costs. The release of this data furth
The U.S. Producer Price Index (PPI) for July rose 0.9% MoM and 3.3% YoY, with both final demand services and goods facing upward pressure from rising raw material costs. The release of this data further dashed market expectations for a total of 75 basis points in rate cuts this year.
The U.S. Dollar Index reversed its earlier losses, climbing from a low of 97.44 to 98.14. Gold prices came under pressure as the stronger dollar weighed on demand, dropping below $3,330 per ounce at the intraday low, with weakness continuing into the Asian trading session.
")
(Figure 1. U.S. July Producer Price Index; Source: BLS)
The PPI release was reinforced by recent hawkish comments from Federal Reserve officials, pushing U.S. Treasury yields higher:
Austan Goolsbee, President of the Chicago Fed, warned on Aug. 13 that the Fed should avoid cutting rates again until inflation is fully under control, implying that upcoming policy meetings will remain “live” until the final decision is made.
Raphael Bostic, President of the Atlanta Fed, stated the same day that if the labor market remains strong, a single rate cut in 2025 would still be appropriate.
Mary Daly, President of the San Francisco Fed, noted there is no need for a 50 bps rate cut in September, cautioning that such a move would require an unexpected emergency.
- (Figure 2. U.S. Treasury General Account; Source: MacroMicro)
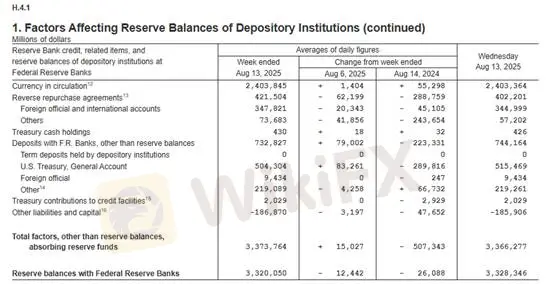
(Figure 3. Bank reserves remain around $3.3 trillion; Source: Federal Reserve)
Stop-loss suggestion: $15
Support levels: $3,333–$3,335
Resistance levels: $3,353–$3,355 / $3,373–$3,374
From a broader perspective, even if the Feds pace of rate cuts remains slow this year, the accumulated easing momentum could be released all at once—potentially intensifying end-demand contraction. From an investment standpoint, this dynamic could boost savings rates. In other words, while the downside risk for the remainder of the year remains macroeconomic in nature (continued liquidity tightening), accumulated savings in the latter half of the year could serve as a potential driver of consumption in the year ahead.
On liquidity, we continue to monitor the Treasury General Account (TGA). The U.S. Treasury‘s cash balance has doubled from its June low of $260 billion to $515.4 billion. While the decline in bank reserves has been limited, the structural downtrend will continue to drain market liquidity, gradually suppressing gold’s upward momentum.
")
As markets move into the volatile autumn season, the summer rally is losing steam. Investors should keep a close eye on long-term trends and avoid being distracted by short-term noise.
Gold Technical Analysis
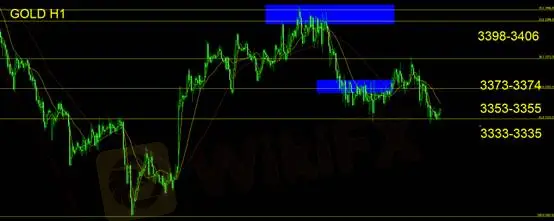
Gold prices continued to test lower levels this week, finding support around the $3,333–$3,335 range, with modest gains in the Asian session. On the daily chart, price action has formed a bearish engulfing pattern—a potential reversal signal. The weekly chart also shows a bearish engulfing combined with an evening star formation, suggesting a broader bearish bias and a potential swing-trade opportunity on the short side.
For existing short positions, stop-losses should be placed to manage short-term volatility. For those currently flat, look for opportunities to initiate shorts if the $3,333–$3,335 support is decisively broken, targeting further downside for potential swing gains.
Risk Disclaimer: The above views, analysis, research, prices, or other information are provided as general market commentary and do not represent the position of this platform. All viewers must bear full responsibility for their own trading decisions. Please trade with caution.
Disclaimer:
Le opinioni di questo articolo rappresentano solo le opinioni personali dell’autore e non costituiscono consulenza in materia di investimenti per questa piattaforma. La piattaforma non garantisce l’accuratezza, la completezza e la tempestività delle informazioni relative all’articolo, né è responsabile delle perdite causate dall’uso o dall’affidamento delle informazioni relative all’articolo.
WikiFX Trader
Plus500
Sotto supervisione
AVATRADE
Sotto supervisione
HFM
Sotto supervisione
ATFX
Sotto supervisione
JustMarkets
Sotto supervisione
octa
Sotto supervisione
Plus500
Sotto supervisione
AVATRADE
Sotto supervisione
HFM
Sotto supervisione
ATFX
Sotto supervisione
JustMarkets
Sotto supervisione
octa
Sotto supervisione
Rate Calc
USD

CNY
Tasso di cambio attuale: 0
inserisci l'importo
USD
A disposizione
CNY
Calcolare