
Applicazione di richiesta di informazioni sulla regolamentazione dei broker globali
WikiFX
English
简体中文
繁體中文
English
Pусский
日本語
ภาษาไทย
Tiếng Việt
Bahasa Indonesia
Español
हिन्दी
Filippiiniläinen
Français
Deutsch
Português
Türkçe
한국어
العربية
FPG ETHUSD Market Report August 14, 2025
Sommario:ETHUSD traded around 4,741.27 after an aggressive multi-week rally that pushed price straight into a major resistance zone at 4,827.51. This surge marks one of the steepest weekly advances in recent m
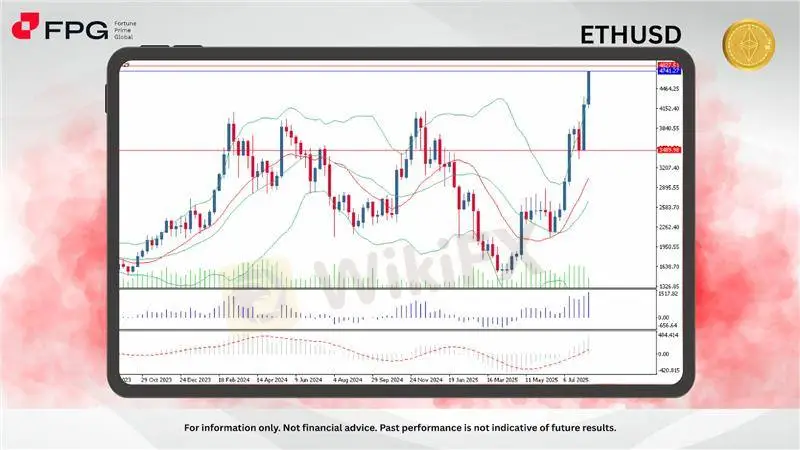
ETHUSD traded around 4,741.27 after an aggressive multi-week rally that pushed price straight into a major resistance zone at 4,827.51. This surge marks one of the steepest weekly advances in recent months, driven by strong bullish sentiment. Price has broken decisively above the 3,489.98 resistance level, and momentum remains heavily in favor of buyers, though proximity to a historical top area invites caution.
The current weekly candle is tall and bullish, extending well above the upper Bollinger Band, signaling strong momentum but also a potential overextension in the short term. Price is now testing the 4,827.51 resistance, a level that capped previous major upswings.
Bulls Power (13) stands at 1,418.98, reflecting extreme bullish pressure. MACD (12,26,9) is accelerating sharply, with the histogram expanding upward, confirming strong trend continuation potential. However, price trading far above its 20-week moving average and the upper Bollinger Band suggests stretched conditions that could prompt a pullback or sideways consolidation before attempting a clean breakout.
Momentum is extremely strong, and trend-following signals remain in favor of bulls. That said, with price now pressing against a long-term resistance zone, traders should prepare for the possibility of profit-taking. If ETH clears 4,827.51 on a weekly close, it would open the path toward 5,200–5,500. If rejected, a retest toward 4,150–4,300 could follow before the next leg higher.
Market Observation & Strategy Advice
1. Current position: ETHUSD traded around 4,741.27, just under the key 4,827.51 resistance after an extended rally.
2. Resistance: 4,827.51 – Major multi-year high; breakout could trigger strong follow-through buying.
3. Support: 4,150–4,300 – First demand zone; deeper support at 3,489.98.
4. Indicators: Bulls Power (13): 1,418.98 – Very strong bullish dominance. MACD (12,26,9): Positive and expanding – momentum solidly bullish.
5. Trading Strategy Suggestions:
Aggressive bulls may hold positions but should monitor closely for rejection signals at 4,827.51.
Conservative traders could wait for either a confirmed breakout above 4,827.51 or a pullback toward 4,300 for better risk-reward entries.
Short setups are risky at this stage unless clear reversal patterns form on lower timeframes.
Market Performance:
Crypto Last Price % Change
BTCUSD 123,757 +0.32%
LTCUSD 131.65 +0.54%
Today's Key Economic Calendar:
UK: GDP Growth Rate QoQ & YoY Prel
UK: GDP MoM
US: PPI MoM
Risk Disclaimer This report is for informational purposes only and does not constitute financial advice. Investments involve risks, and past performance does not guarantee future results. Consult your financial advisor for personalized investment strategies.
Disclaimer:
Le opinioni di questo articolo rappresentano solo le opinioni personali dell’autore e non costituiscono consulenza in materia di investimenti per questa piattaforma. La piattaforma non garantisce l’accuratezza, la completezza e la tempestività delle informazioni relative all’articolo, né è responsabile delle perdite causate dall’uso o dall’affidamento delle informazioni relative all’articolo.
WikiFX Trader
FXCM
Sotto supervisione
Vantage
Sotto supervisione
GTCFX
Sotto supervisione
AVATRADE
Sotto supervisione
FOREX.com
Supervisione del paese
Plus500
Sotto supervisione
FXCM
Sotto supervisione
Vantage
Sotto supervisione
GTCFX
Sotto supervisione
AVATRADE
Sotto supervisione
FOREX.com
Supervisione del paese
Plus500
Sotto supervisione
Rate Calc
USD

CNY
Tasso di cambio attuale: 0
inserisci l'importo
USD
A disposizione
CNY
Calcolare